Data Preparation
Code for data cleaning can be found here.
Within this repository will be all of the code for the different components of this project. API and Data Cleaning are the first scripts created in this process.
Welcome to the Data Preparation of this project! Effective data preparation is fundamental beginning step for a successful data analysis or machine learning endeavor. This is where we lay the foundation for extracting valuable insights and building robust models. On this page, we’ll delve into the various data sources that are being prepared and used for this project. Below are links and descriptions of these sources as well as discussions into into their origins, importance, and how they’ve been processed and integrated them for analysis. Note that data gathering an cleaning is a unending process so the data sources will adapt throughout the course of this project as a whole.
Sources
News API
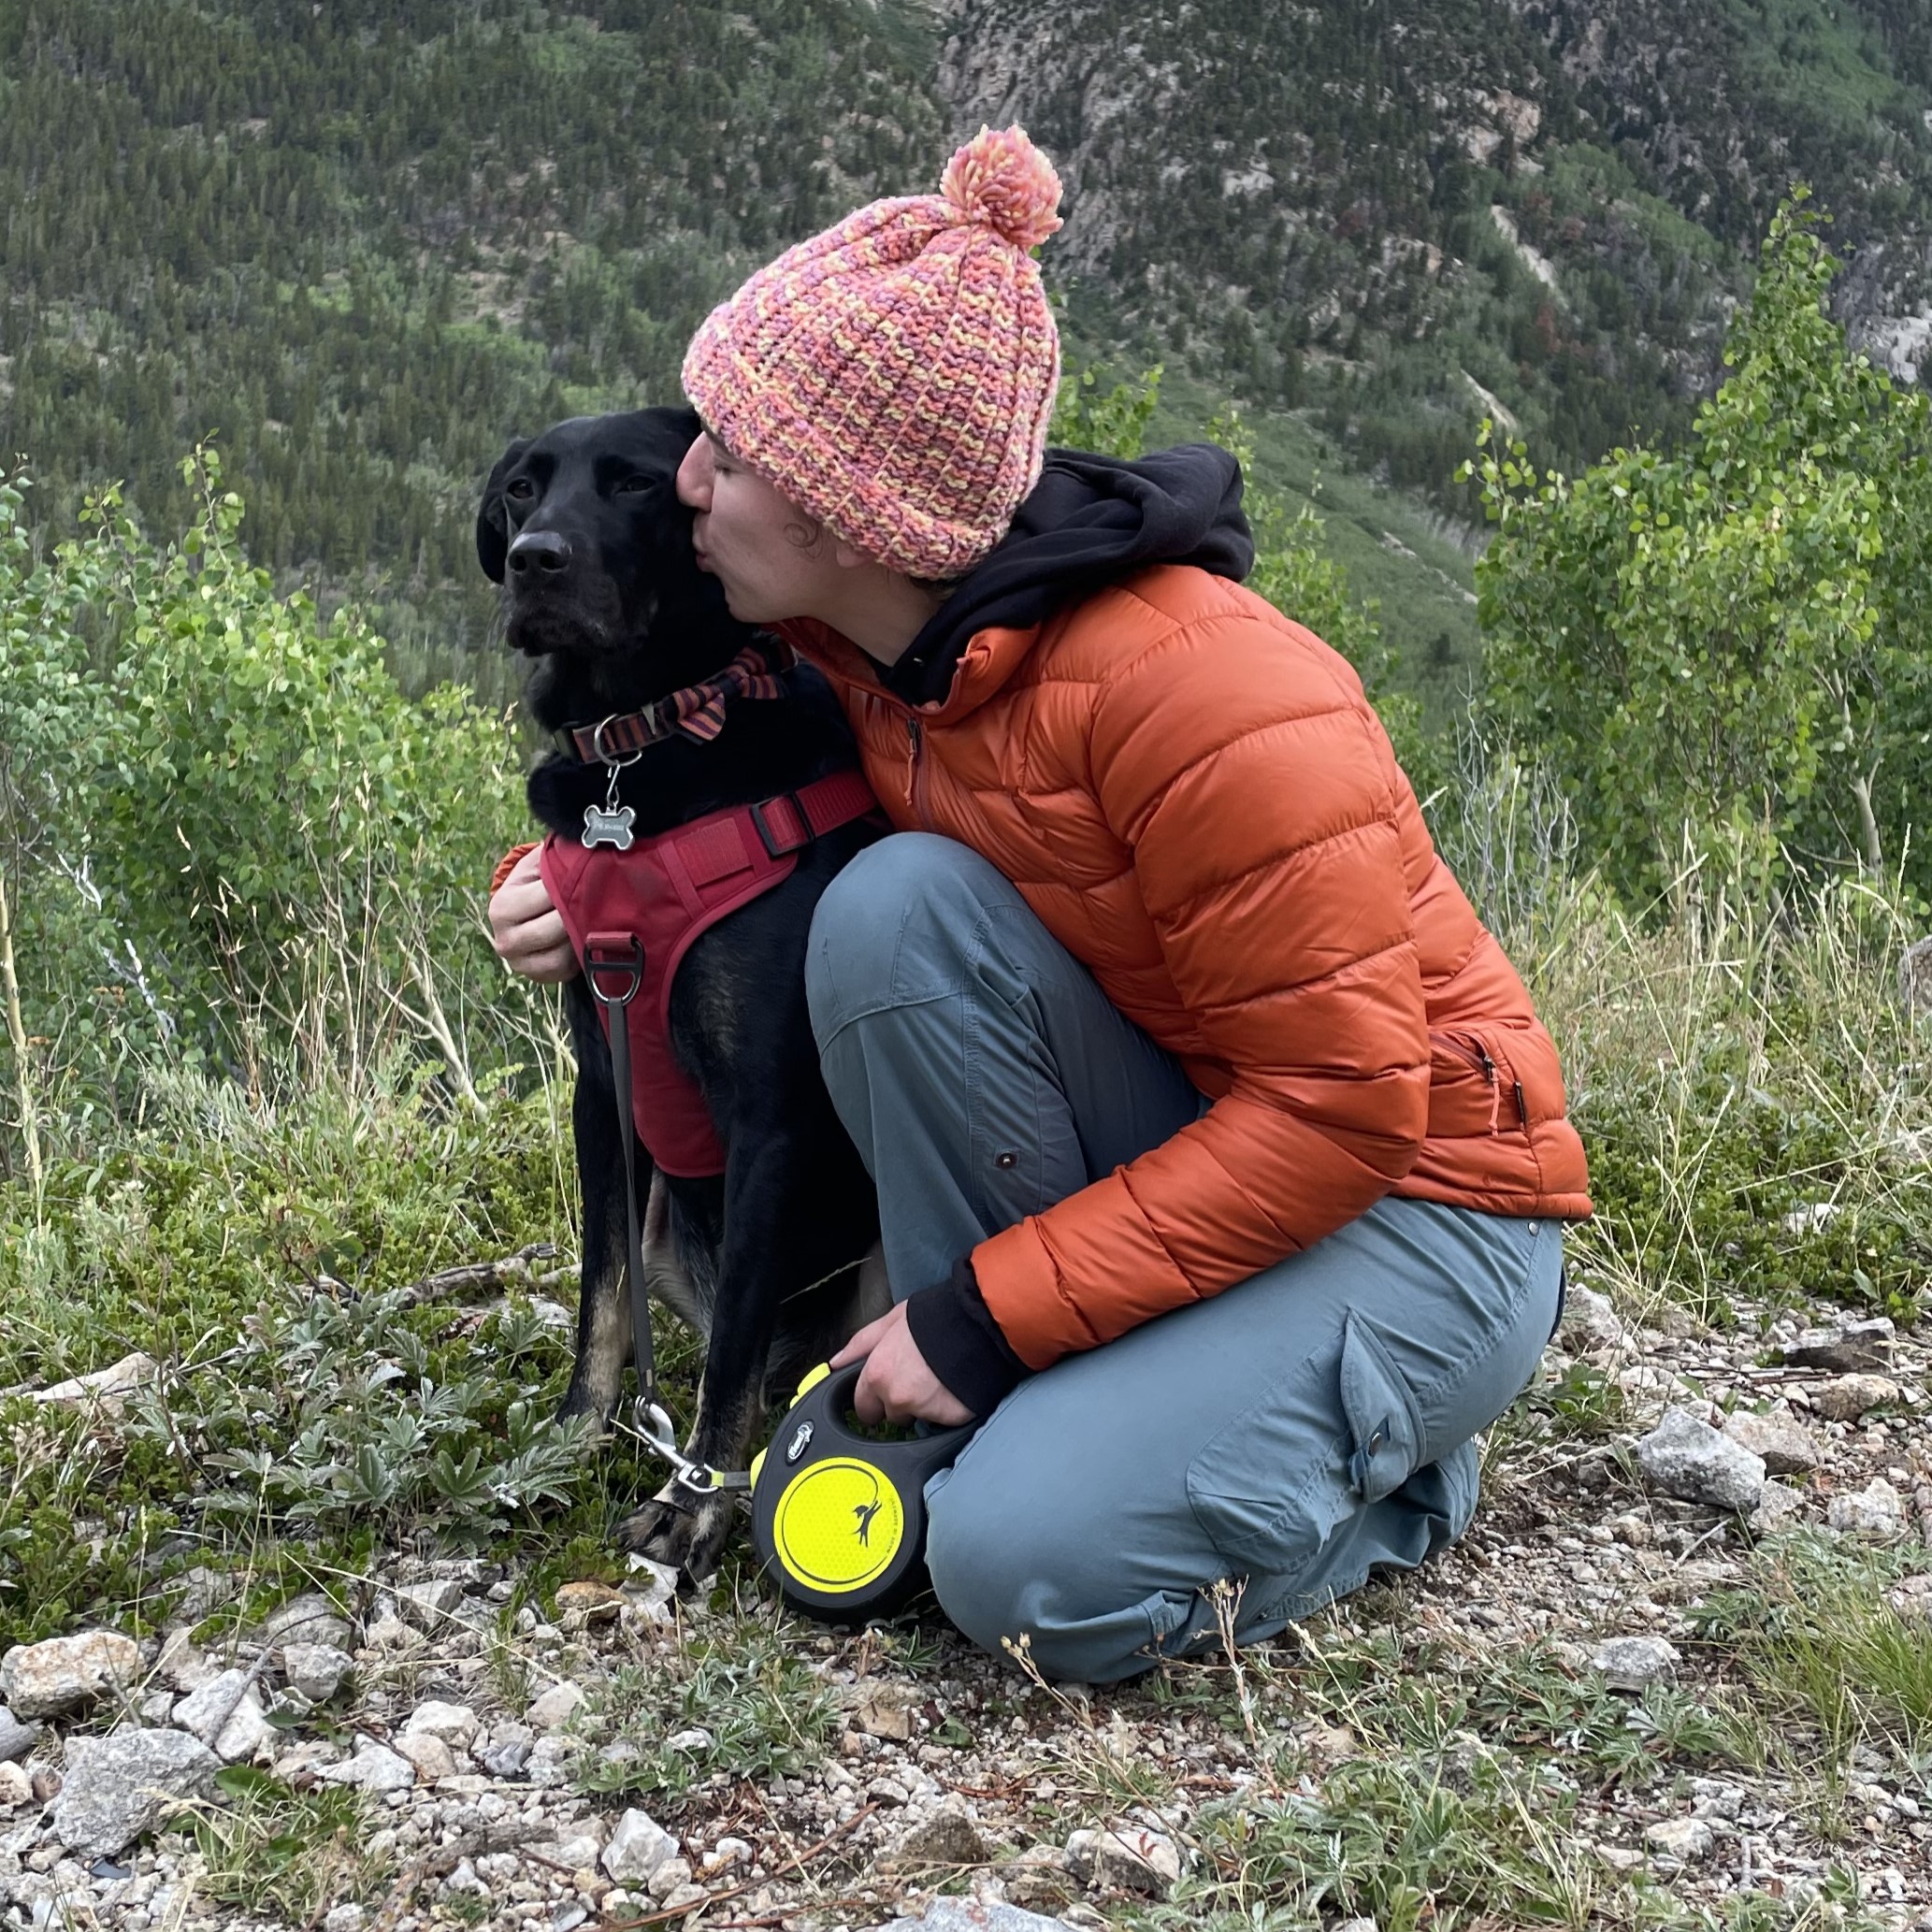
One of the first data sources that was accessed for this project was an API for news article headings. Utilizing a news API is a powerful way to stay updated with real-time information from a wide range of sources. By integrating a news API into this project the information can stay relevant and therefore create stronger findings. As seen in the Exploratory Data Analysis section of this page, this API shows some of the social focus on the Maui fire that has been devastating for the locals and environment. This APIs has been used by filtering content by topics. These are not limited by the ones currently selected. This said, the topics of focus are: wildfire, fire, drought, burn, and weather.
This section serves as a window into our data refinement process, transforming raw, unprocessed data into a format that is readily usable. You can access the code responsible for data collection and cleaning within our GitHub repository, available here.
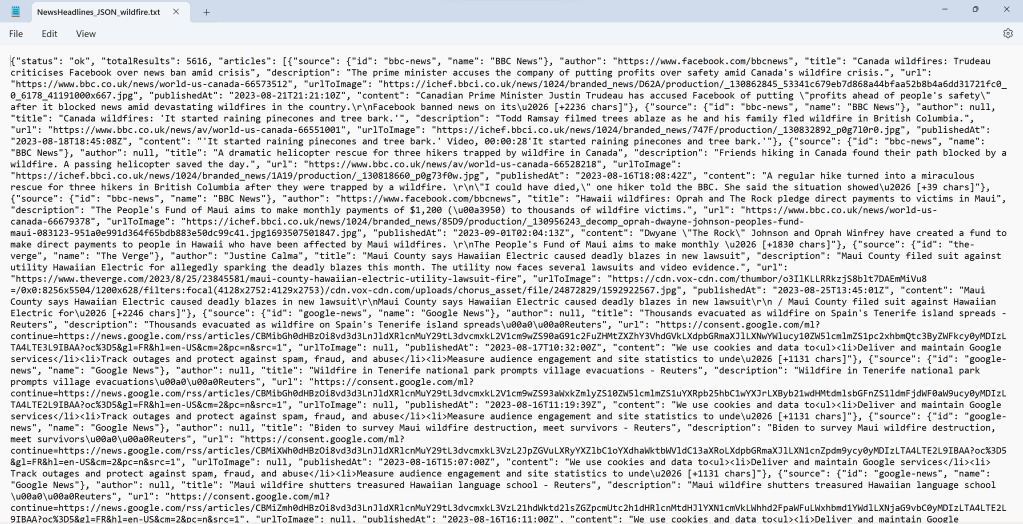
Raw:
JSON text from the News API with the topic of “wildfire”
Date:
September 16th 2023
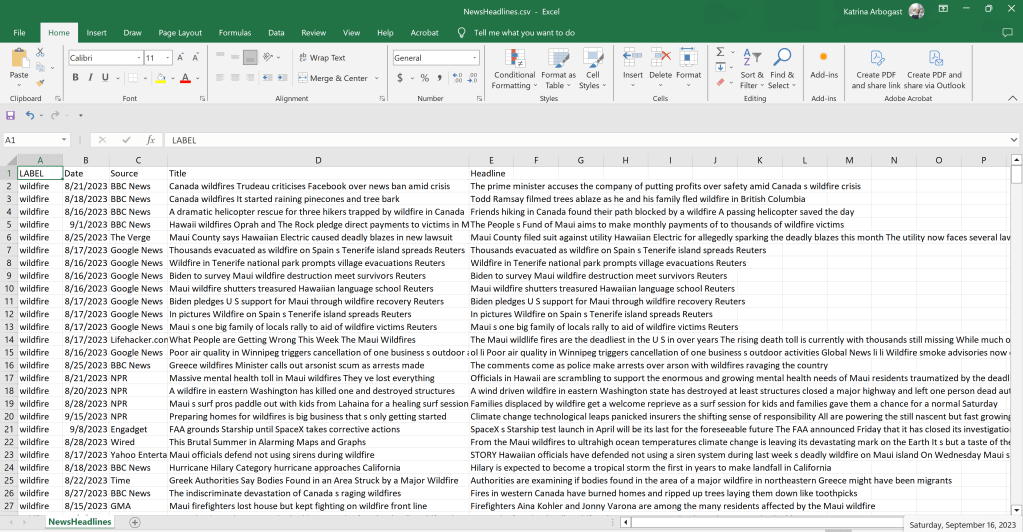
In progress – cleaned:
Cleaned the format of the data and removed unwanted characters and filler words. Is saved as a csv.
Date:
September 16th 2023
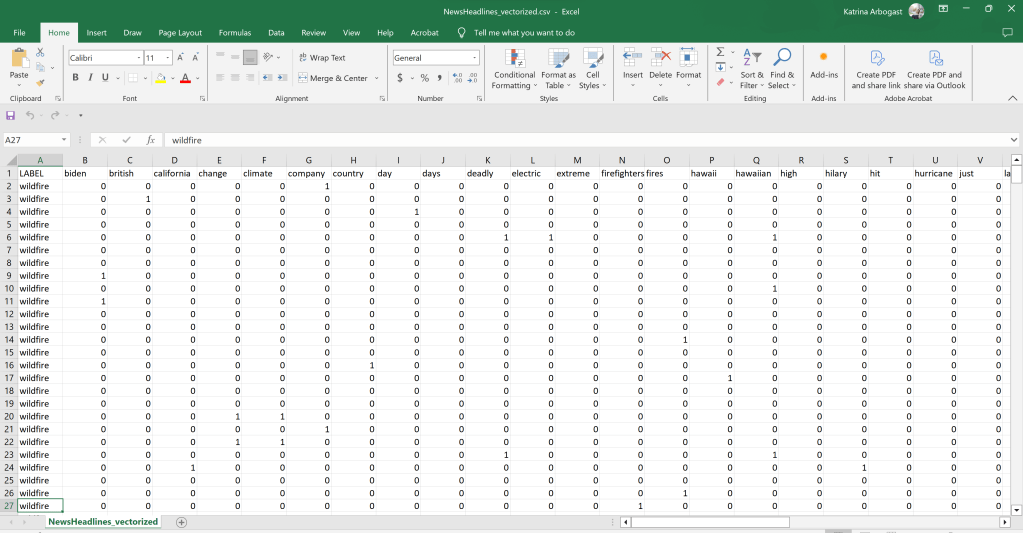
Vectorized – cleaned:
Vectorized data for all the topics (“wildfire”, “fire”, “drought”, “burn”, “weather”). This is designed to show the frequency of specific words mentioned in the articles and is now saved as a csv.
Date:
September 16th 2023
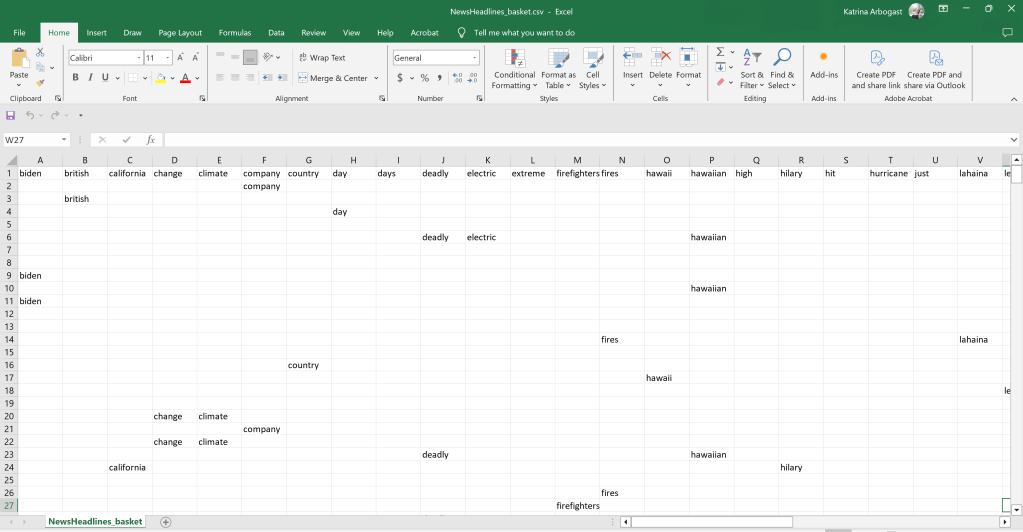
Basket – cleaned:
Taking the vectorized data from above, we replaced the 0’s with empty strings and the counted values with the columns words. This gives a beginning to basket data that can be used for ARM
Date:
September 16th 2023
National Oceanic and Atmospheric Association – National Centers for Environmental Information – U.S. Wildfires
U.S. Wildfire statistics provided by the National Interagency Fire Center (NIFC)
https://www.ncei.noaa.gov/access/monitoring/wildfires/
Another data source used for this project is the monthly statistics of wildfire burn areas in the year 2000 to 2023. This data was provided as a downloadable csv for a particular month in the above time range providing summary values of ‘Acres Burned’, ‘Acres Burned per Fire’, and ‘Number of Fires’. Some cleaning was carried out so that the data would be condensed to one csv containing all of the information for all of the months. This process also included assigning the appropriate data types to the columns. Another level to this was removing the rows for the year 2023. As project is being held in the year 2023, the data is therefore incomplete. Future analyses are encouraged.
You can access the code responsible for data cleaning within our GitHub repository, available here.
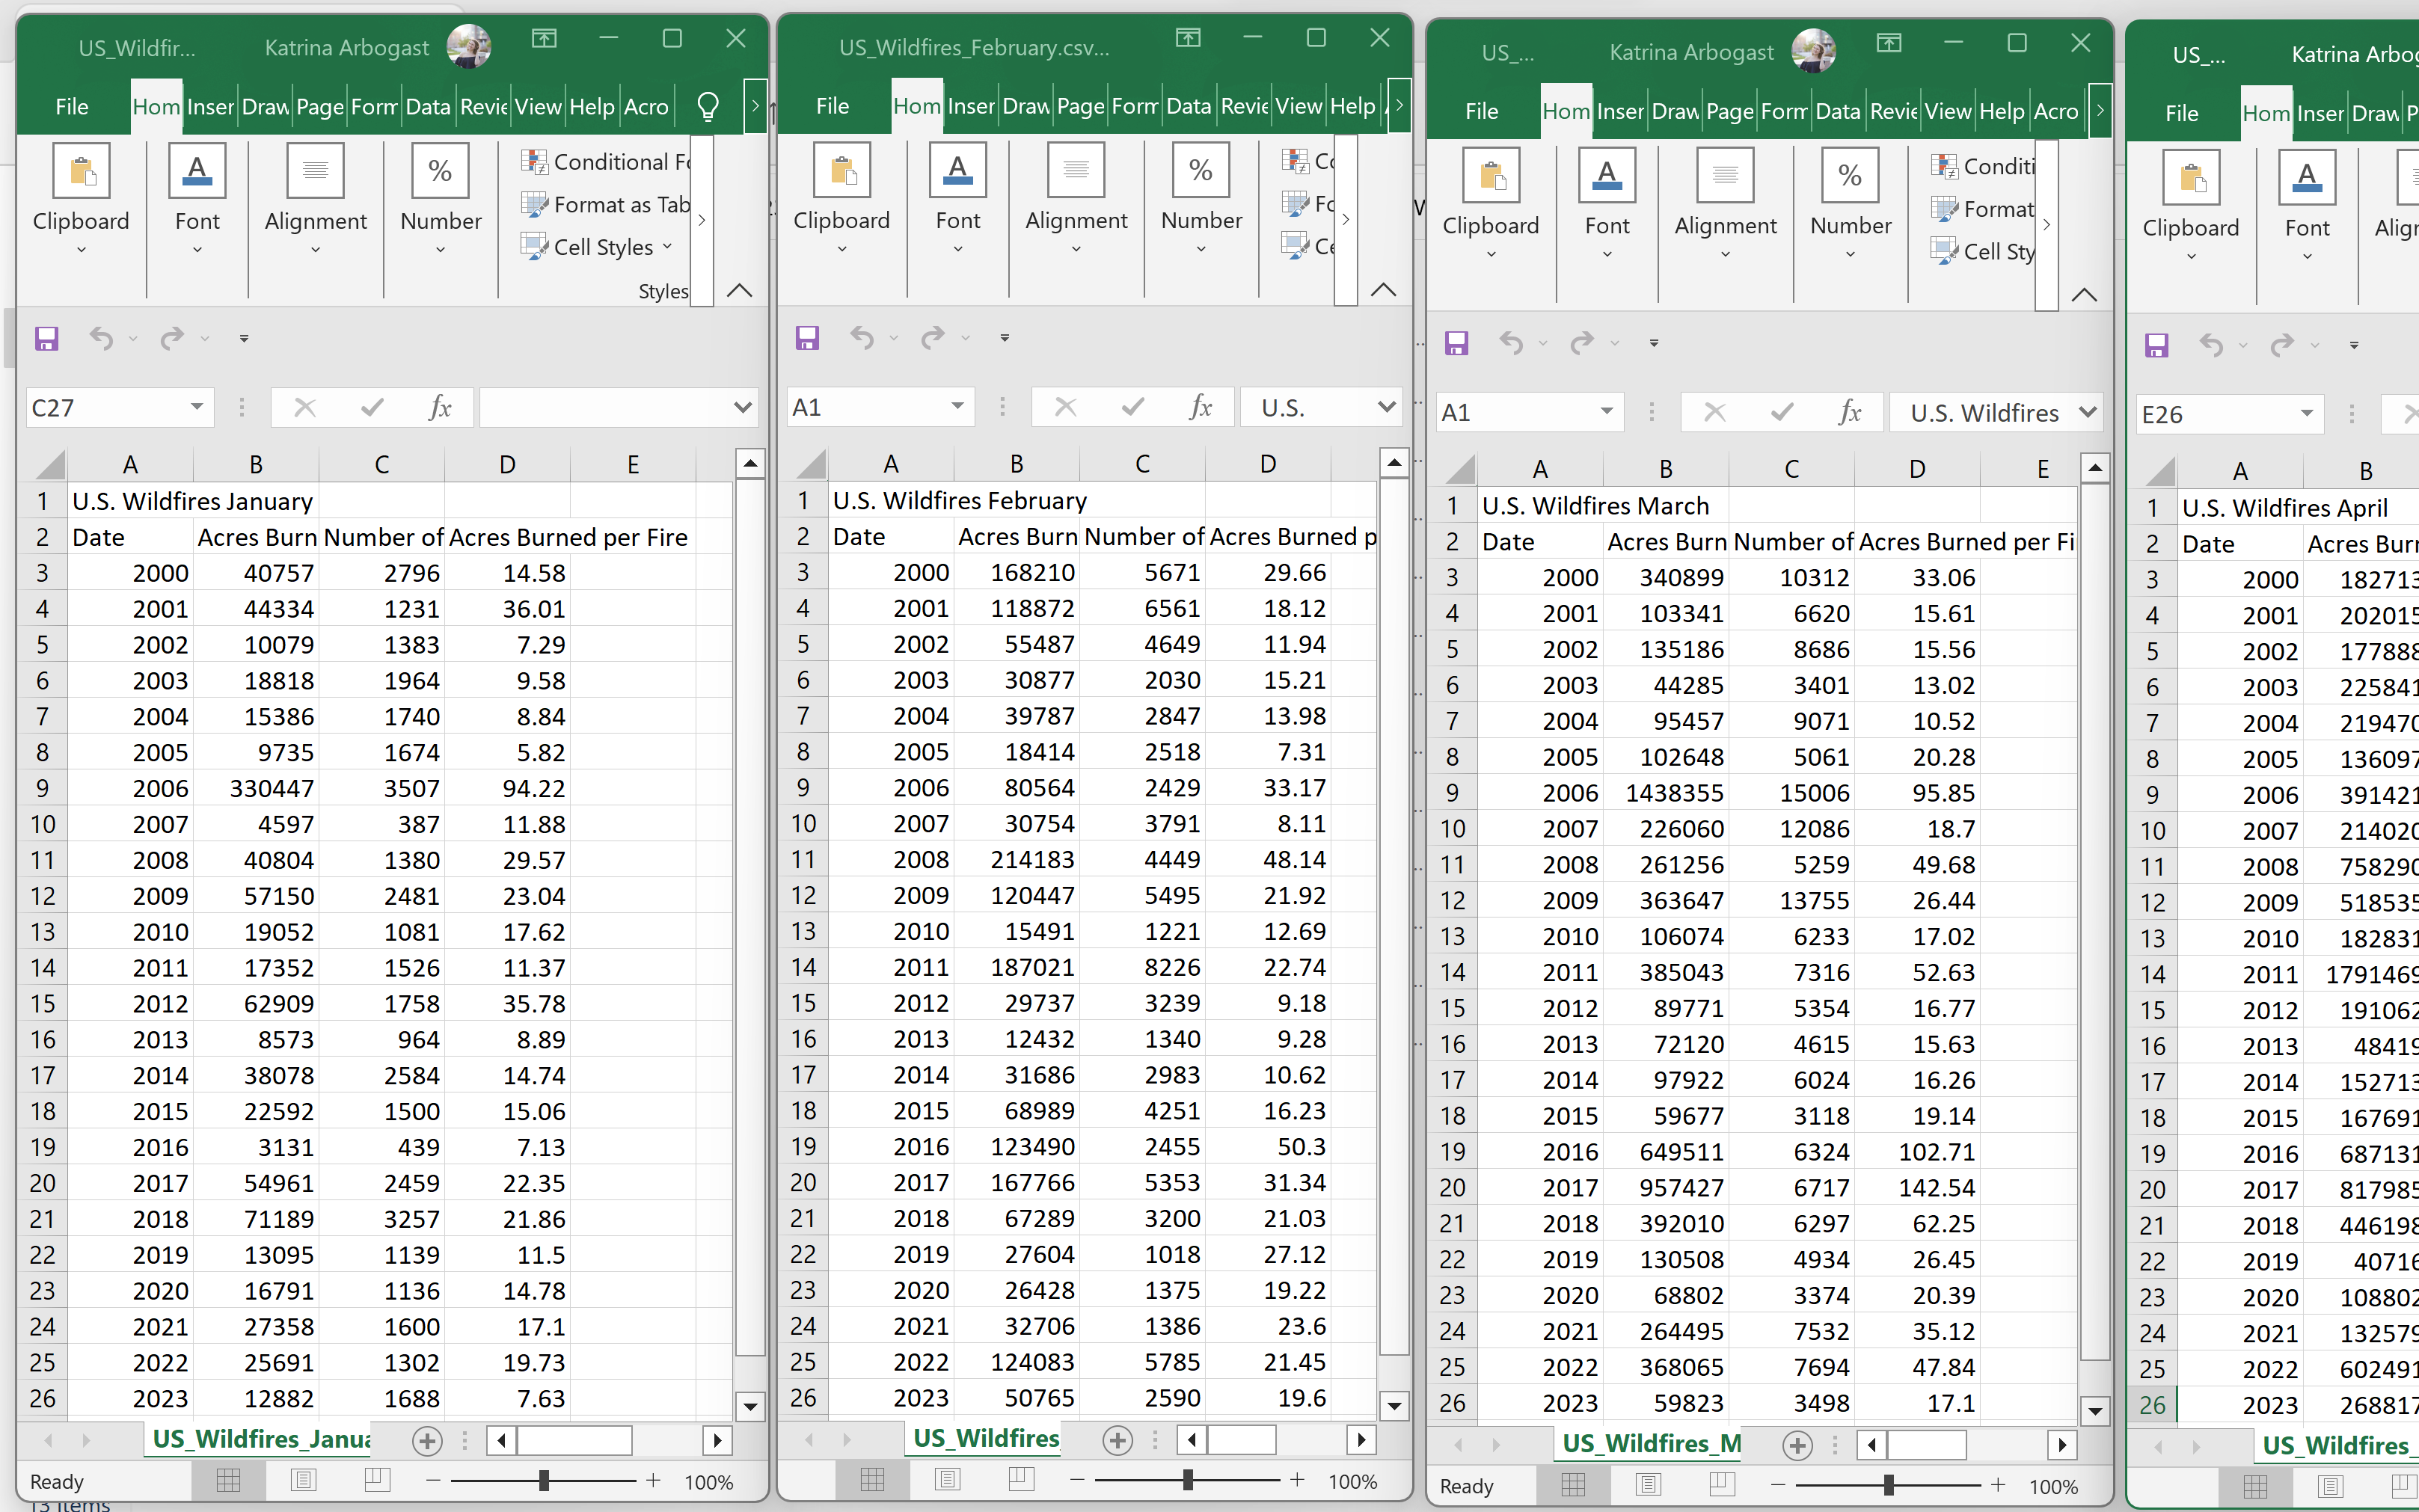
Raw: 2000 to 2023 US wildfire data separated by months
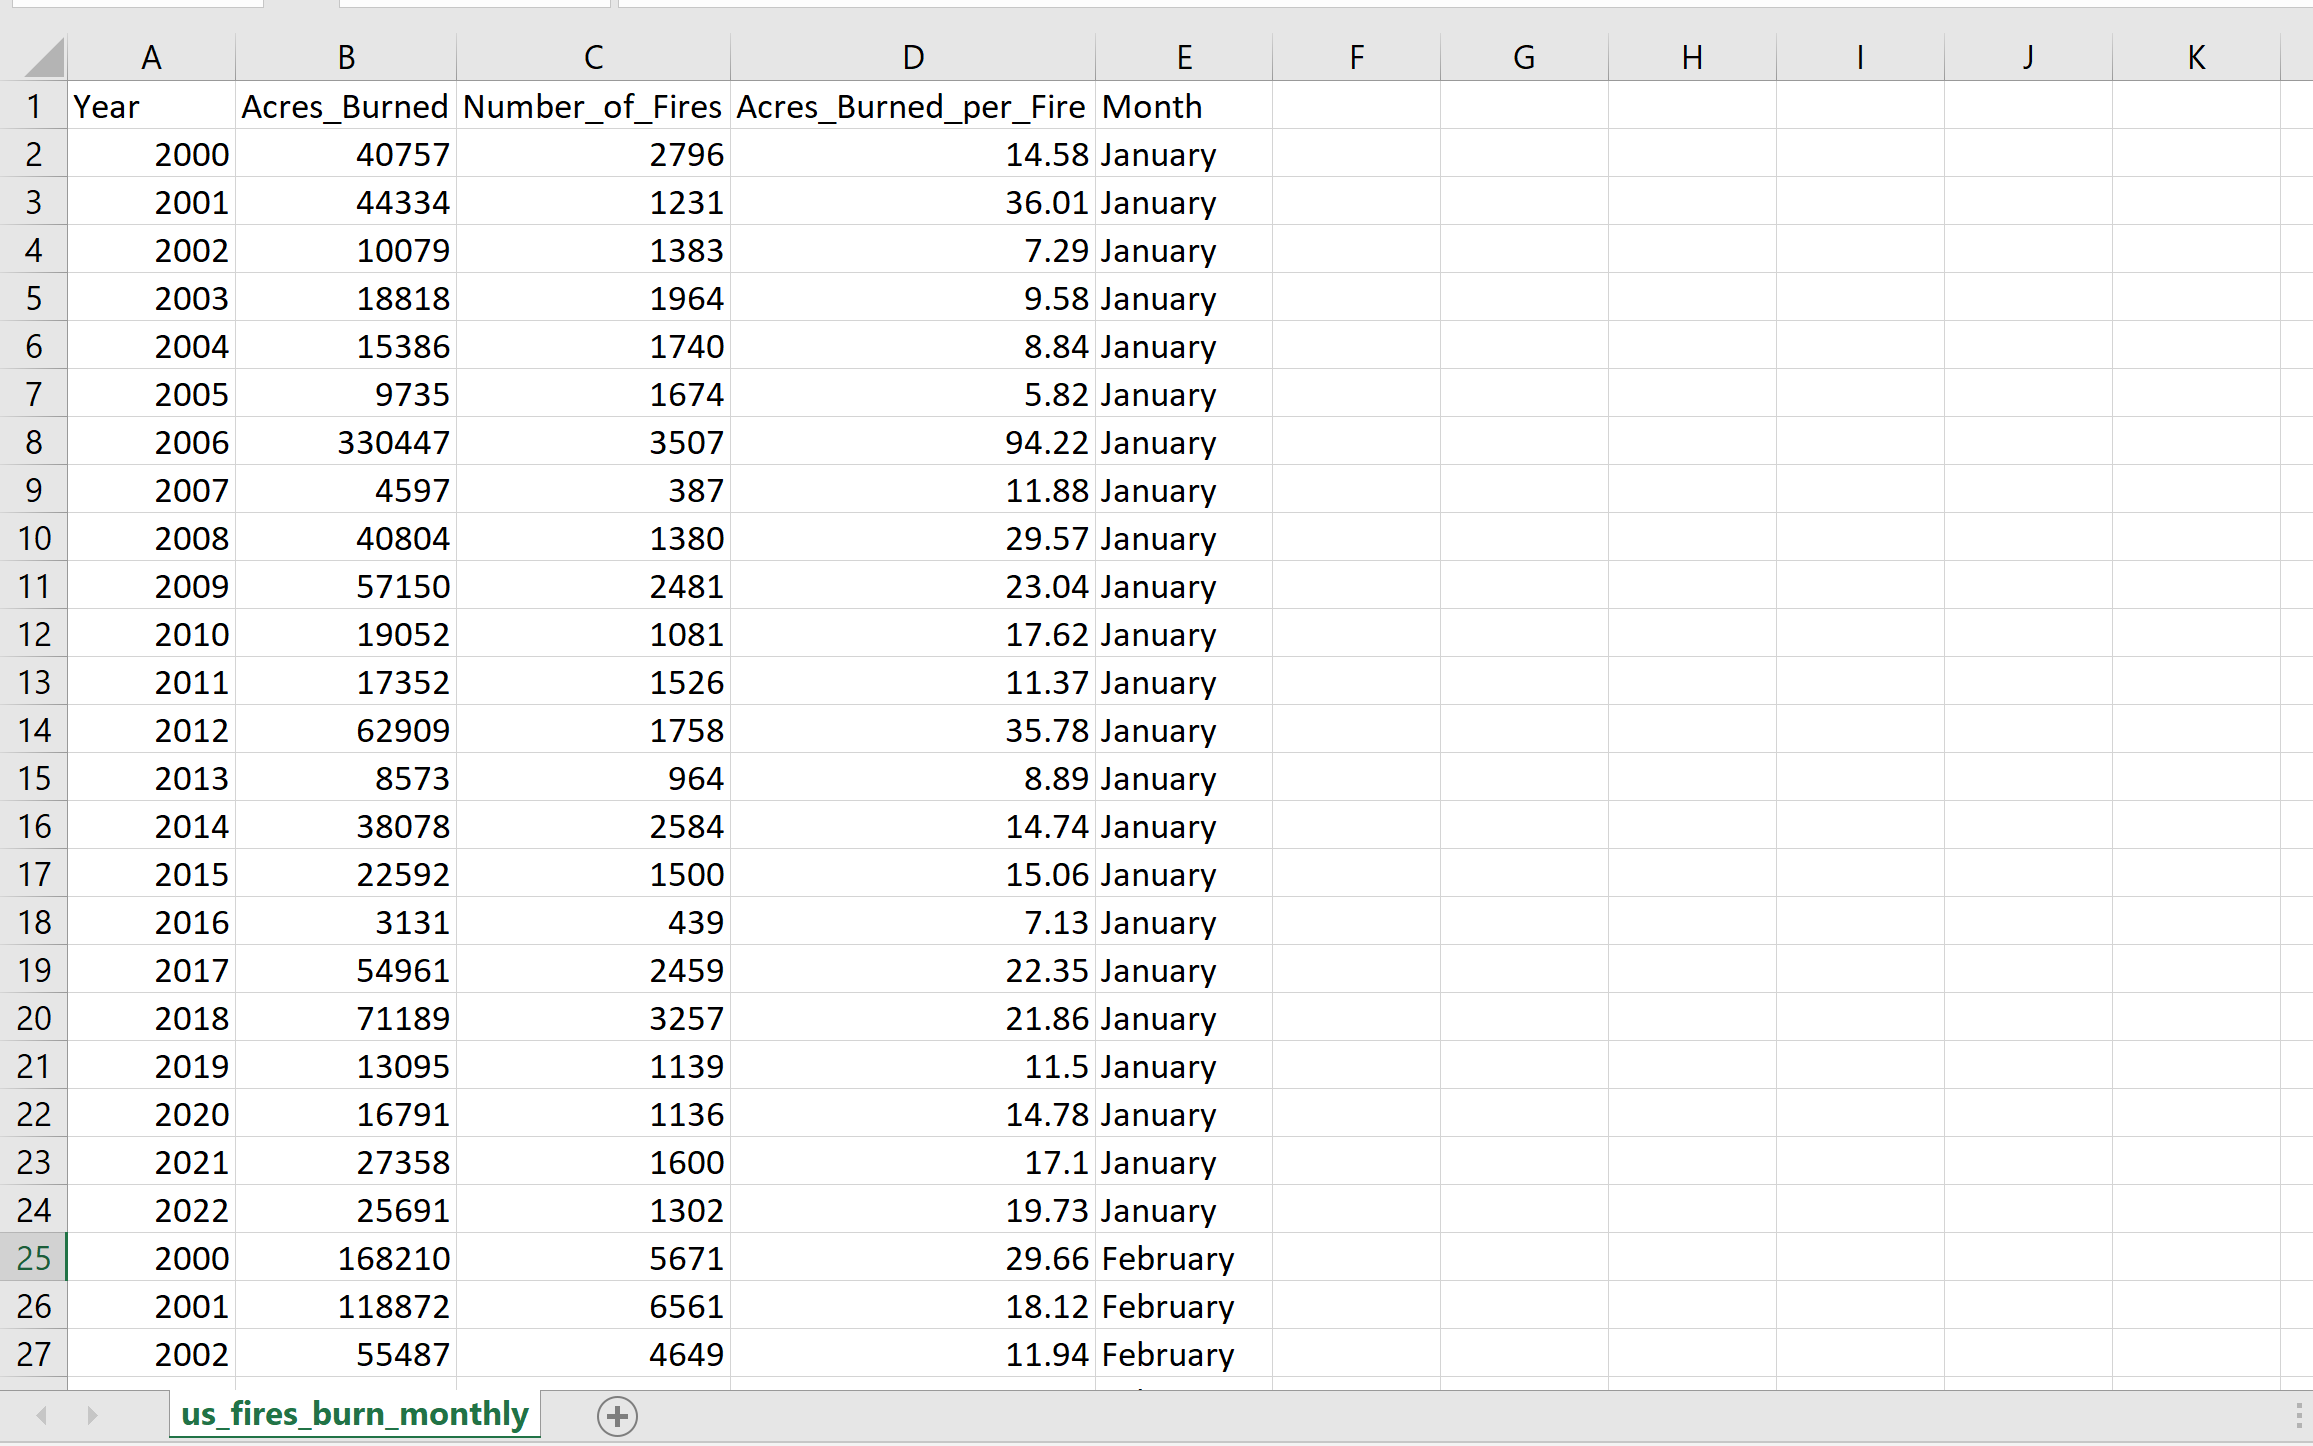
Clean: 2000 to 2023 US wildfire data combined into one useable csv.
U.S. Fire Administration’s (USFA) National Fire Data Center (NFDC)
National Fire Incident Reporting System (NFIRS) Public Data Release files
Federal Emergency Management Agency (FEMA), OpenFEMA Dataset. Retrieved from https://www.fema.gov/about/openfema/data-sets/fema-usfa-nfirs-annual-data on September 13, 2023, 9:30 AM MST. This product uses the FEMA OpenFEMA API, but is not endorsed by FEMA. The Federal Government or FEMA cannot vouch for the data or analyses derived from these data after the data have been retrieved from the Agency’s website(s).
Through this link, many datasets were gathered. Following this link there is data for Fire Incidents and Hazards from 1980 to 2021. The raw data for these datasets will not all be stored on GitHub like other raw datasets are as the exceed the standard memory limits of a single file download. However, the format is such that for each of the years, a zip file can be downloaded which contains various delaminated text files and pdfs. The raw data is contained in the text files and the pdfs are meant to be used as guides for working with the data.
Below is a minor representation of the process of working with the raw data.

Raw Folder Example:
This is one of the subfolders within the usfa_nfirs_2019 data on all incidents.

Raw – causes.txt:
In one of these raw folders, this is an example of one of the raw text files, with ‘^’ delamination.
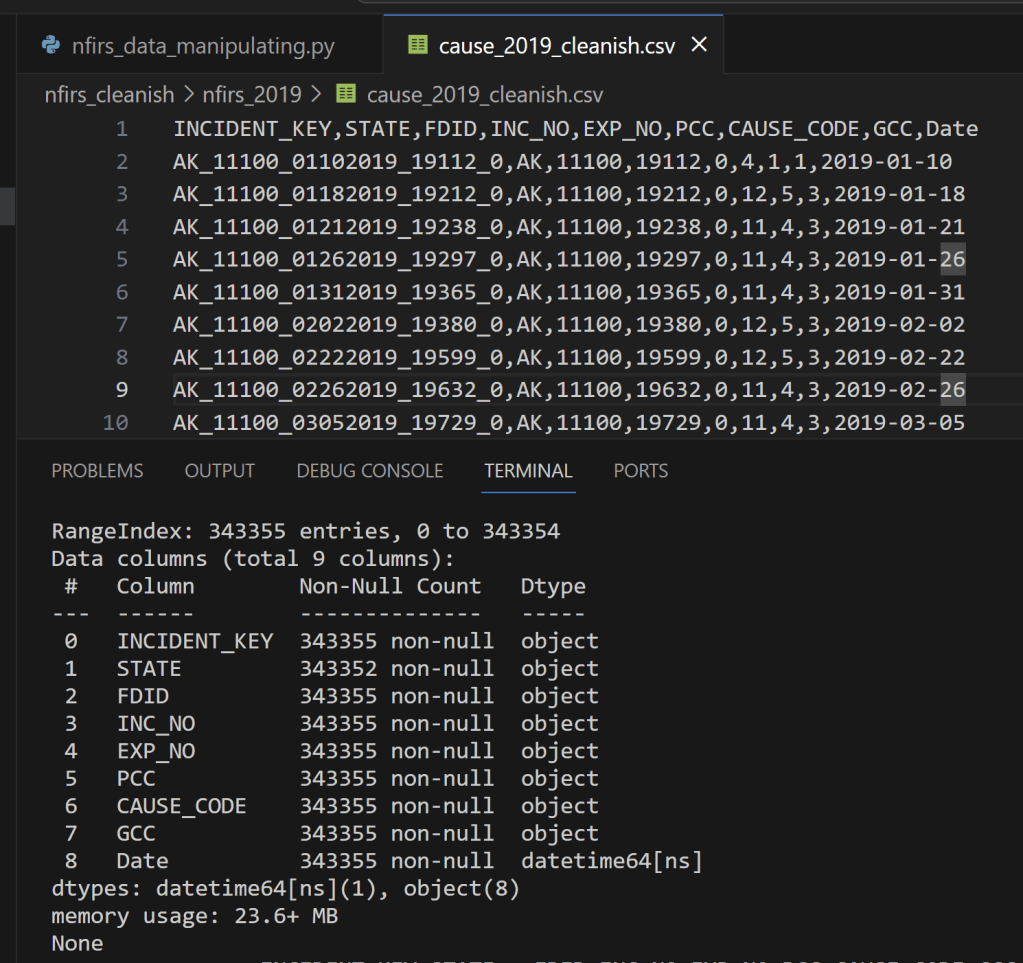
causes.txt – cleaned:
Made the categorical data type object, made the date a date time object, and checked for null or incorrect values.
US Wildfires due to Lightning (2004 – 2015)
https://www.kaggle.com/datasets/aestheteaman01/278k-us-wildfires-due-to-lightning-2004-2015
This dataset is a mostly cleaned csv file that was pulled from Kaggle. Here is information on wildfires between 1992 and 2015 in the US that were specifically caused by lightning. Lightning is a well known cause of fires, and is an unpreventable weather pattern. research into lightning and the resulting fires may lead to safe practices in the future.
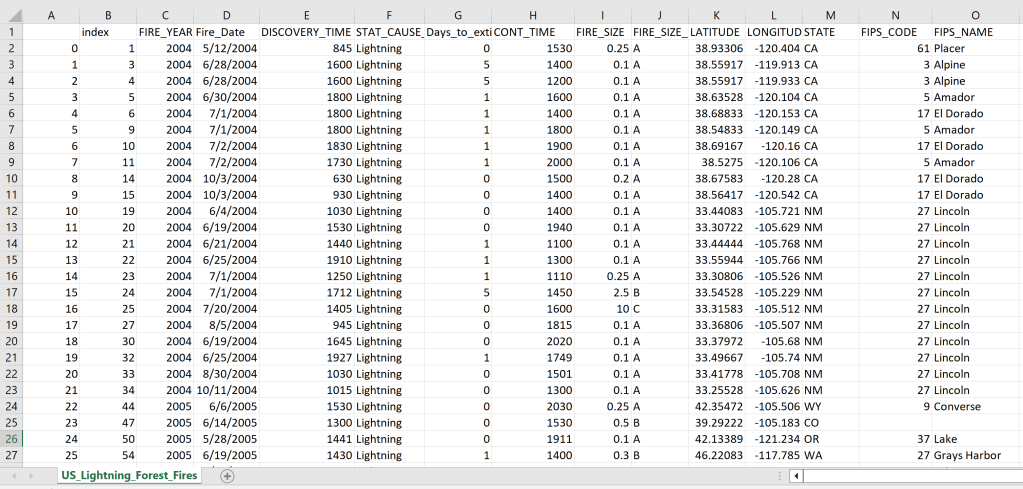
Lightning Dataset Dirty
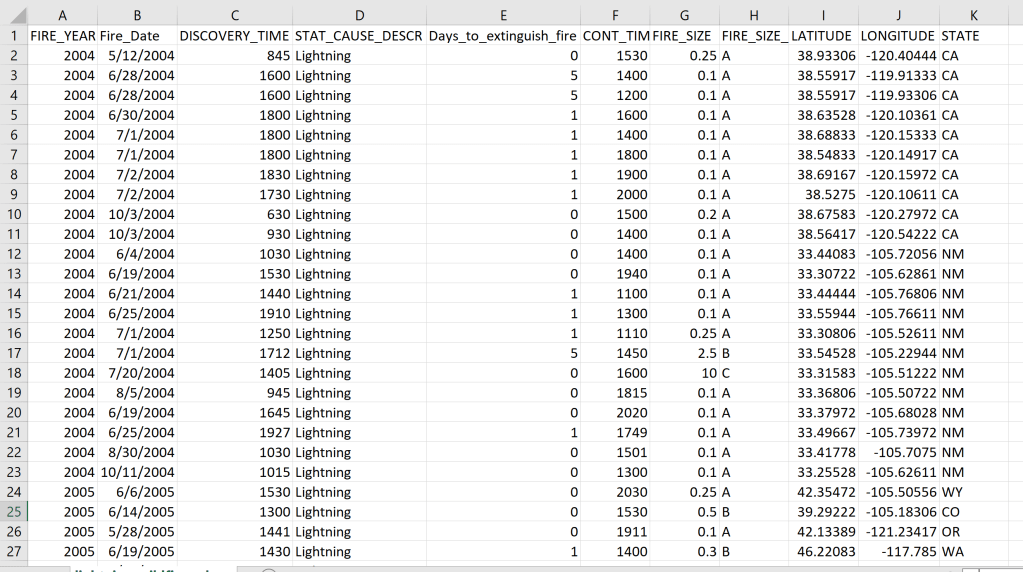
Lightning Dataset Clean:
removed all rows that contained NA values, and removed columns FIPS as these contained many NA values. Removed index columns
2.3 Million Wildfires – kaggle
https://www.kaggle.com/datasets/braddarrow/23-million-wildfires
Short, Karen C. 2022. Spatial wildfire occurrence data for the United States, 1992-2020 [FPA_FOD_20221014]. 6th Edition. Fort Collins, CO: Forest Service Research Data Archive. https://doi.org/10.2737/RDS-2013-0009.6
Table including wildfire data for the period of 1992-2020 compiled from US federal, state, and local reporting systems. The following core data elements were required for records to be included in this data publication: discovery date, final fire size, and a point location. This dataset spans many year in high detail and therefore the file is quite massive. The code for how this data is provided in the GitHub repository, however, only the cleaned and narrowed down data is given as the raw was unable to be supported by GitHub. The raw data can be found at the kaggle link above.
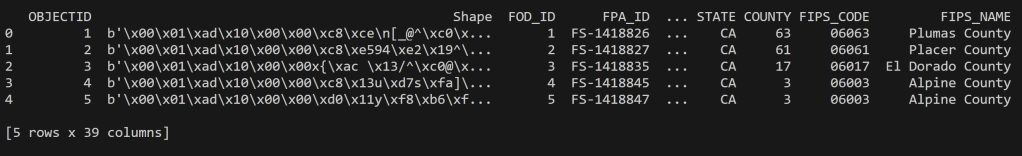
2.3 Million Wildfires Dataset Dirty
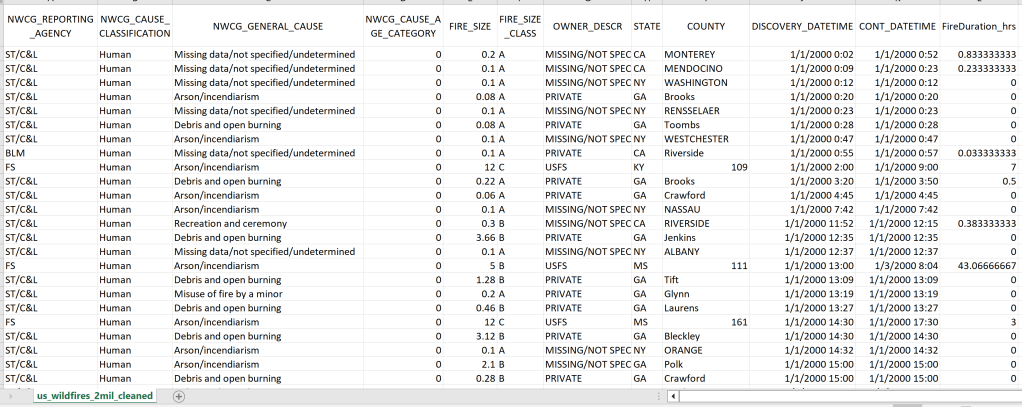
Wildfires Dataset Clean:
Dropped columns that were not desired in the further analyses or if they had too many NA values. Selected years 2000 to 2020. Fixed columns data types, and reduced categorical values to integer values to reduce memory. Removed rows with NA values. Added a fire duration column based on the date time of Discovery and the Containment times.
Oregon Wildfire and Weather Data (2000 – 2022) – kaggle
https://www.kaggle.com/datasets/lauraparsons/oregon-wildfire-weather-and-cause-data-2000-2022
Wildfire Data: The wildfire data by the Oregon Department of Forestry (ODF) from 2000 to 2022.
Weather Data: Weather data was obtained from NOAA and merged with the wildfire data using ‘County’ and ‘Date’ as the common identifiers.
Wildfire Data Source: Fire Occurrence and Cause Data 2000-2022 : https://www.kaggle.com/datasets/mattop/fire-occurrence-and-cause-data-2000-2022
Weather Data Source: NOAA : https://noaa-nclimgrid-daily-pds.s3.amazonaws.com/index.html#EpiNOAA/v1-0-0/
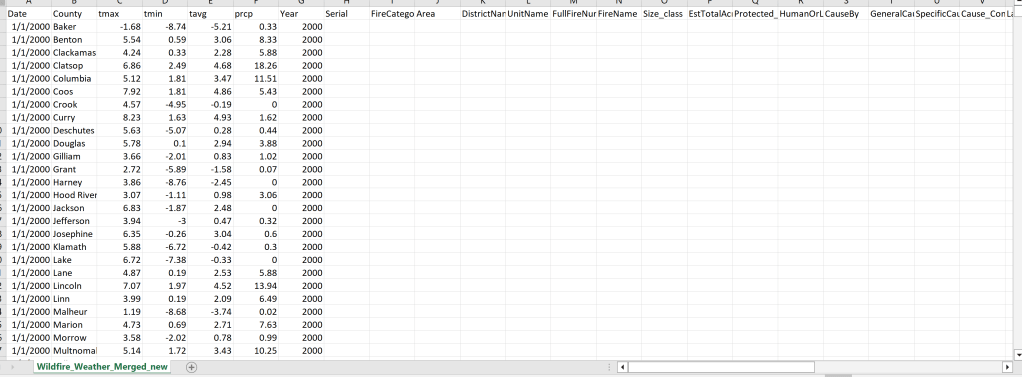
Oregon Wildfire and Weather Data Dirty
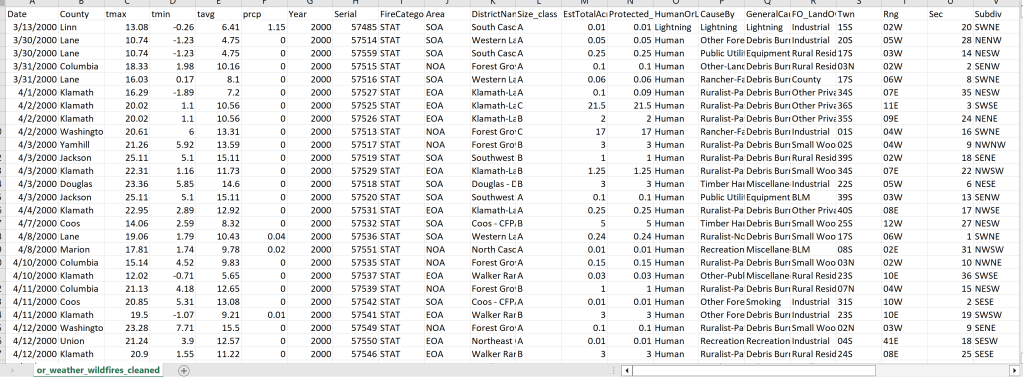
Oregon Wildfire and Weather Data Clean:
Drops columns that are not needed for analysis or have too many NA. Remove rows with na values. Fix data types. Create a column that is the fires duration
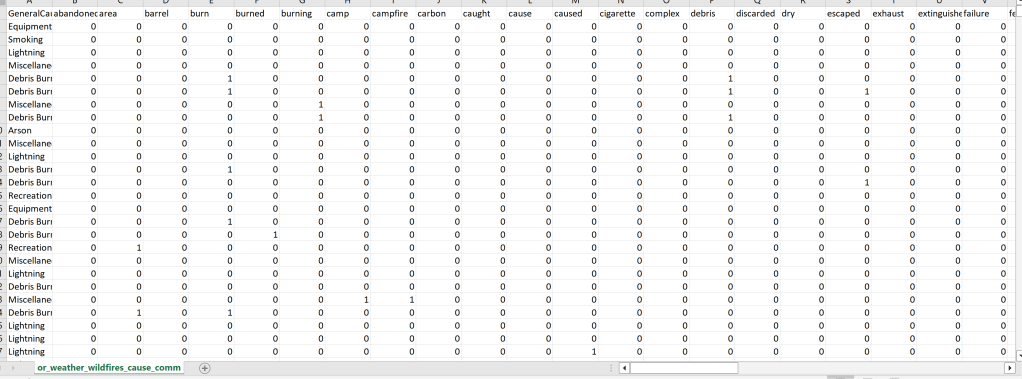
Oregon Wildfire and Weather Cause Comments Vectorized

Oregon Wildfire and Weather Cause Comments Basket
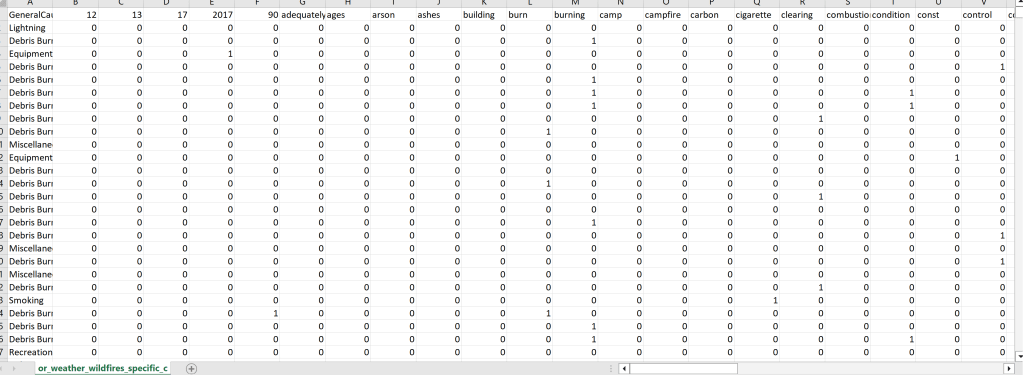
Oregon Wildfire and Weather Specific Causes Vectorized

Oregon Wildfire and Weather Specific Causes Basket
US Drought Monitor
https://droughtmonitor.unl.edu/DmData/DataDownload/ComprehensiveStatistics.aspx
The U.S. Drought Monitor is produced through a partnership between the National Drought Mitigation Center at the University of Nebraska-Lincoln, the United States Department of Agriculture and the National Oceanic and Atmospheric Administration.
This data has either the total number of acres affected by the drought category per state on that date, or the percentage of the states area that is affected by that drought category.
Drought Severity and Coverage Index – DSCI
Not Dry/Drought: None
Dryness Category: D0-Abnormally Dry—used for areas showing dryness but not yet in drought, or for areas recovering from drought.
Drought Category Intensity Level: D1-Moderate Drought, D2-Severe Drought, D3-Extreme Drought, D4-Exceptional Drought
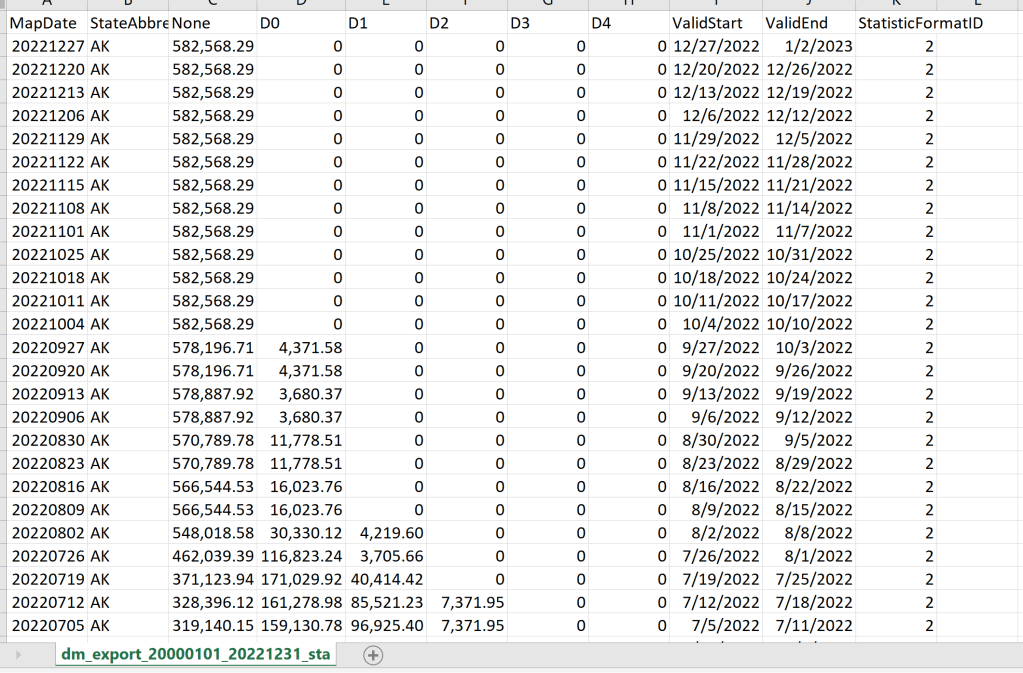
Drought Monitor State Total Area Dirty
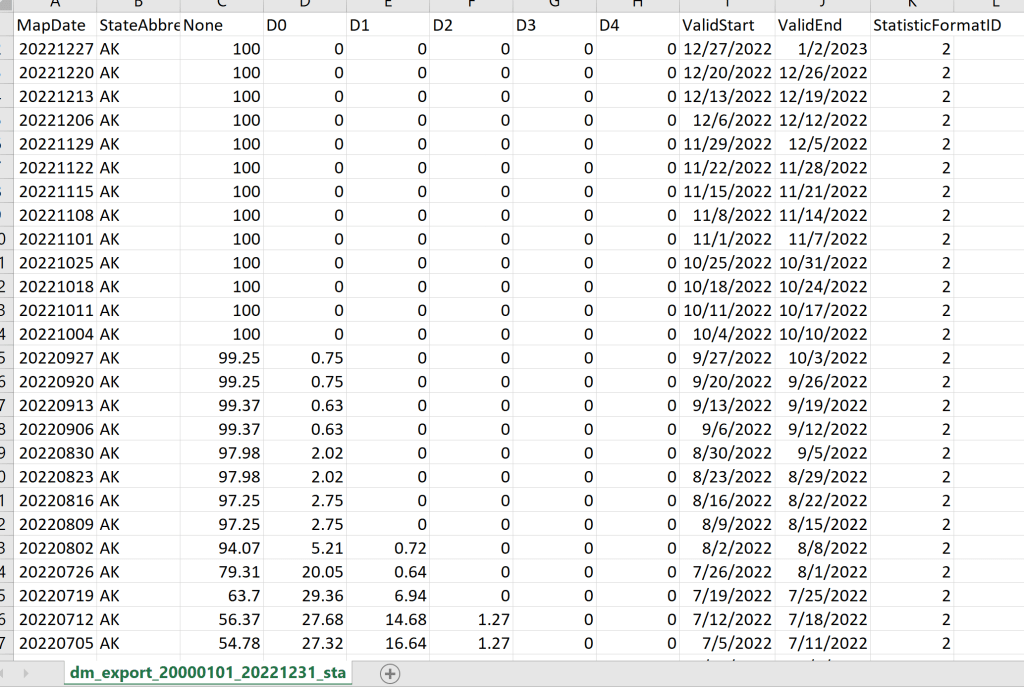
Drought Monitor State Percent Dirty
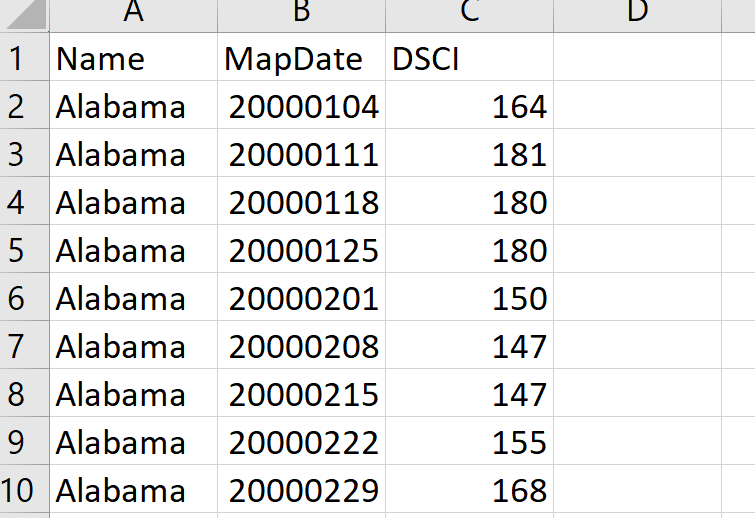
Drought Monitor State DSCI Dirty
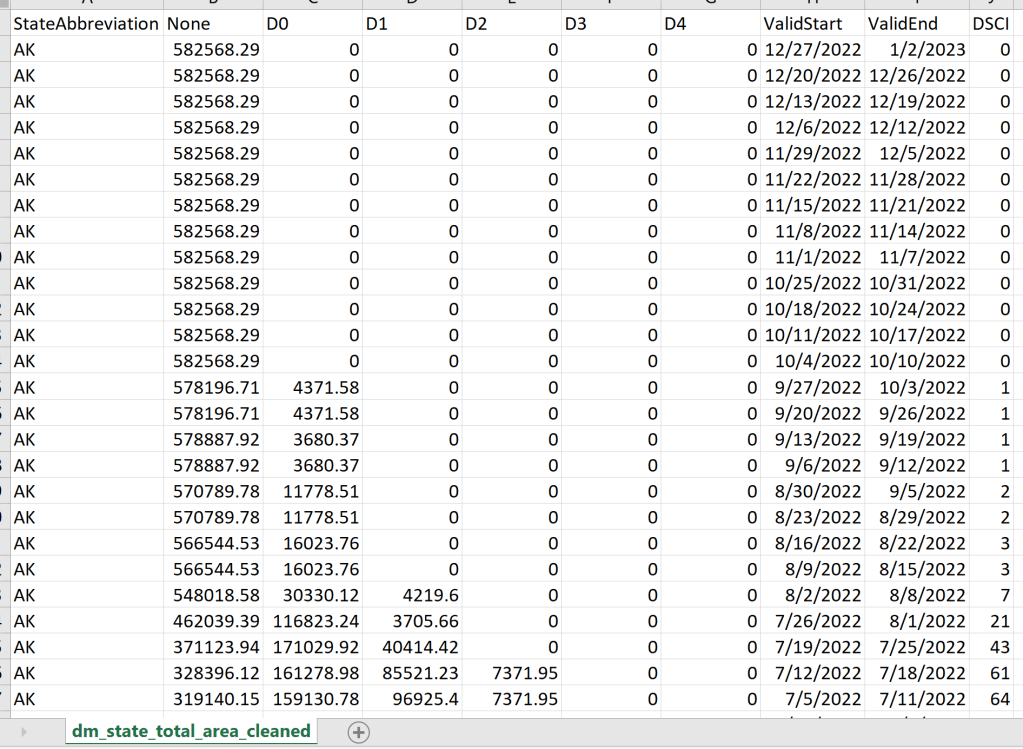
Drought Monitor State Total Area Cleaned:
Removes NA rows (which were actually none). Fixed the values to not have commas. Fixed the data types of the date columns. Merged DSCI based on the MAPDATE and then removed MAPDATE
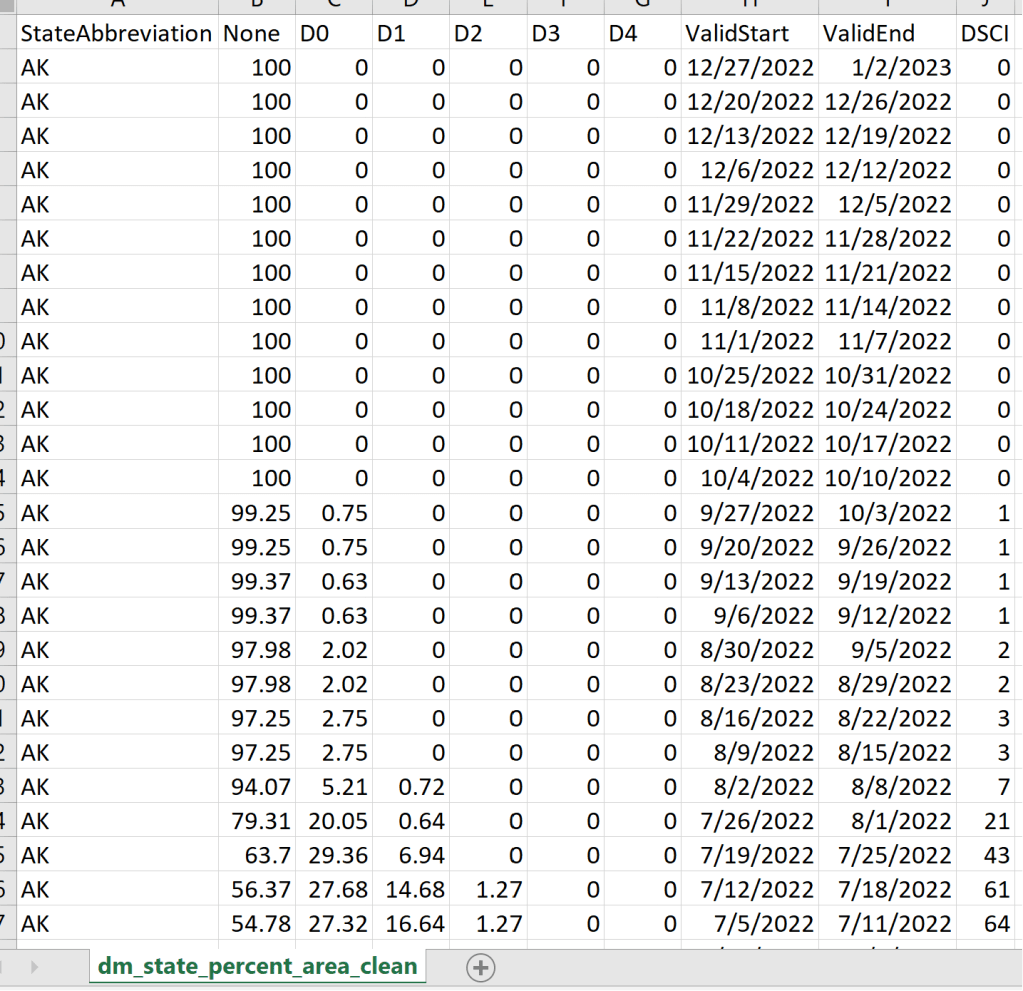
Drought Monitor State Percent Area Cleaned:
Removes NA rows (which were actually none). Fixed the data types of the date columns. Merged DSCI based on the MAPDATE and then removed MAPDATE
Other Data Sources of Interest
The data sources below can be extremely value in further modeling and analysis, the process of cleaning is extensive and therefore it is an on going progress.
California WildFires (2013-2020) – kaggle
https://www.kaggle.com/datasets/ananthu017/california-wildfire-incidents-20132020
This dataset takes a closer look into the different variables associated with California fires.
As one of the interest areas of the focus questions is around how drought and other weather patterns may affect fires, there datasets below would also be extremely beneficial in creating better models.
Predict Droughts using Weather & Soil Data – kaggle
https://www.kaggle.com/datasets/cdminix/us-drought-meteorological-data?select=soil_data.csv
EDAs
To explore the various data sets many visuals were made, and then still quite a few saved for future topic analysis and discussions. These exploratory data analysis visuals were curated through Python and R. The code responsible is accessible at the GitHub repository located here.
Recent Frequencies of Topics around Wildfires and Drought in the News
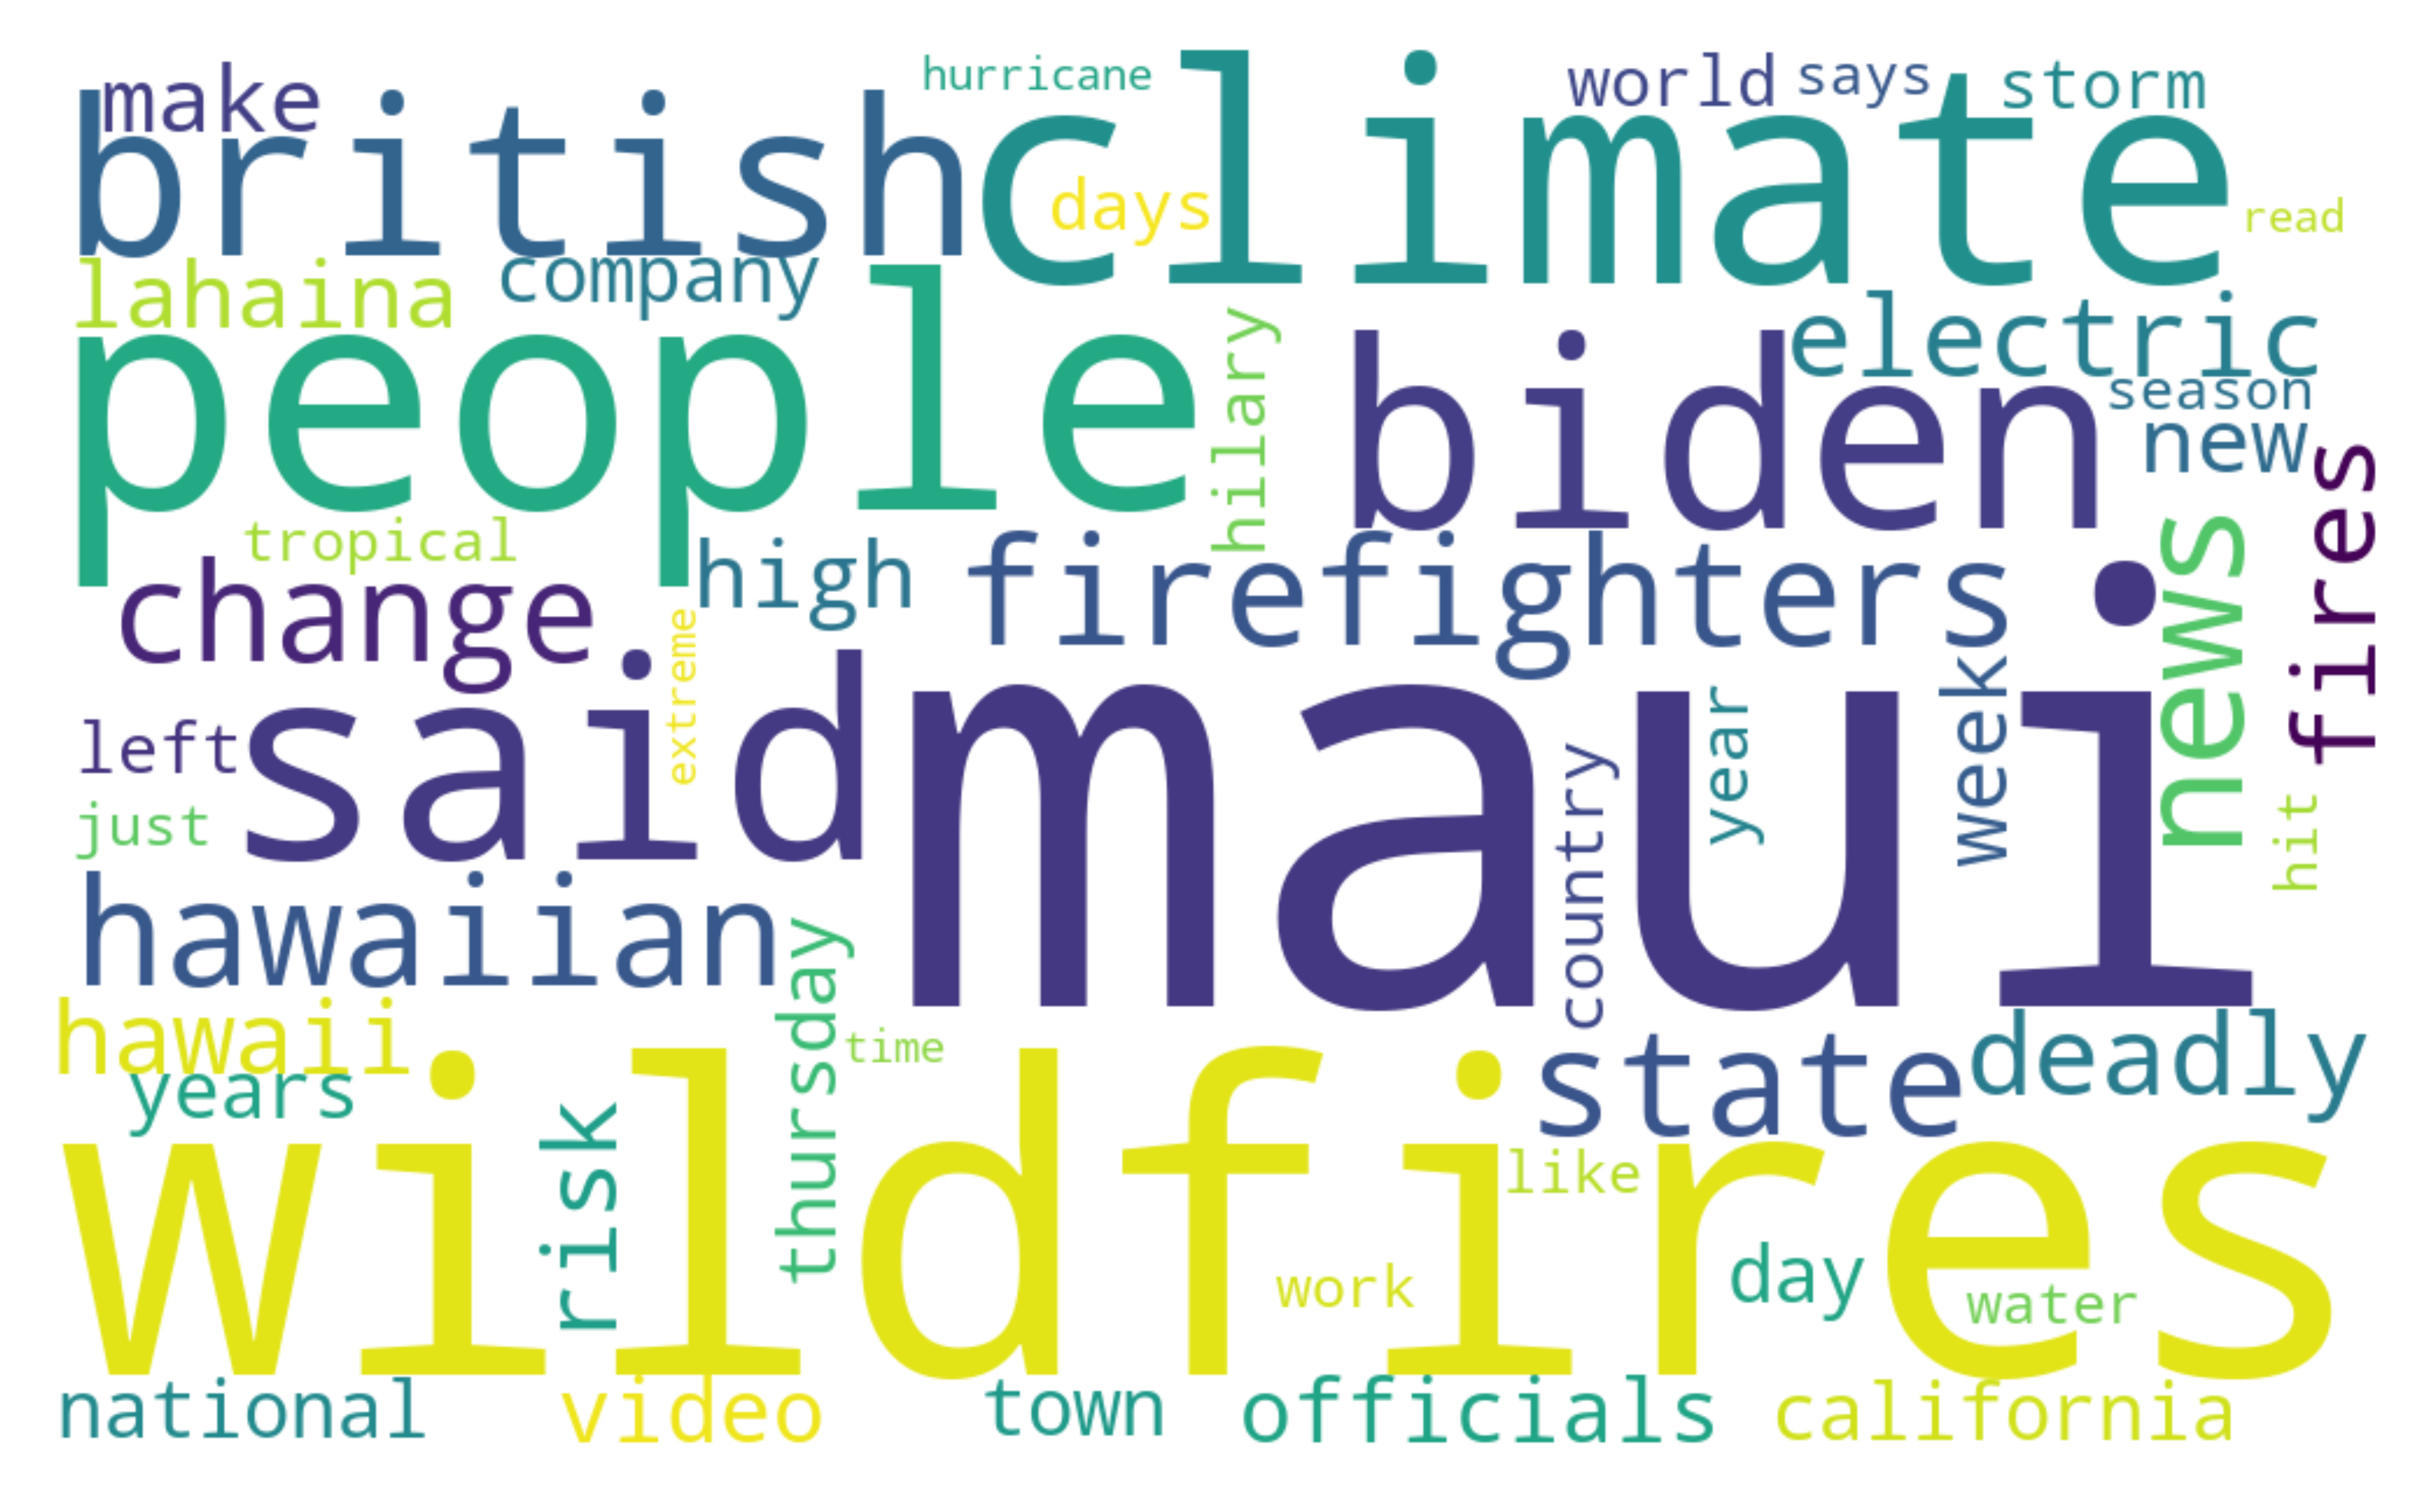
News API Word Cloud – wildfire
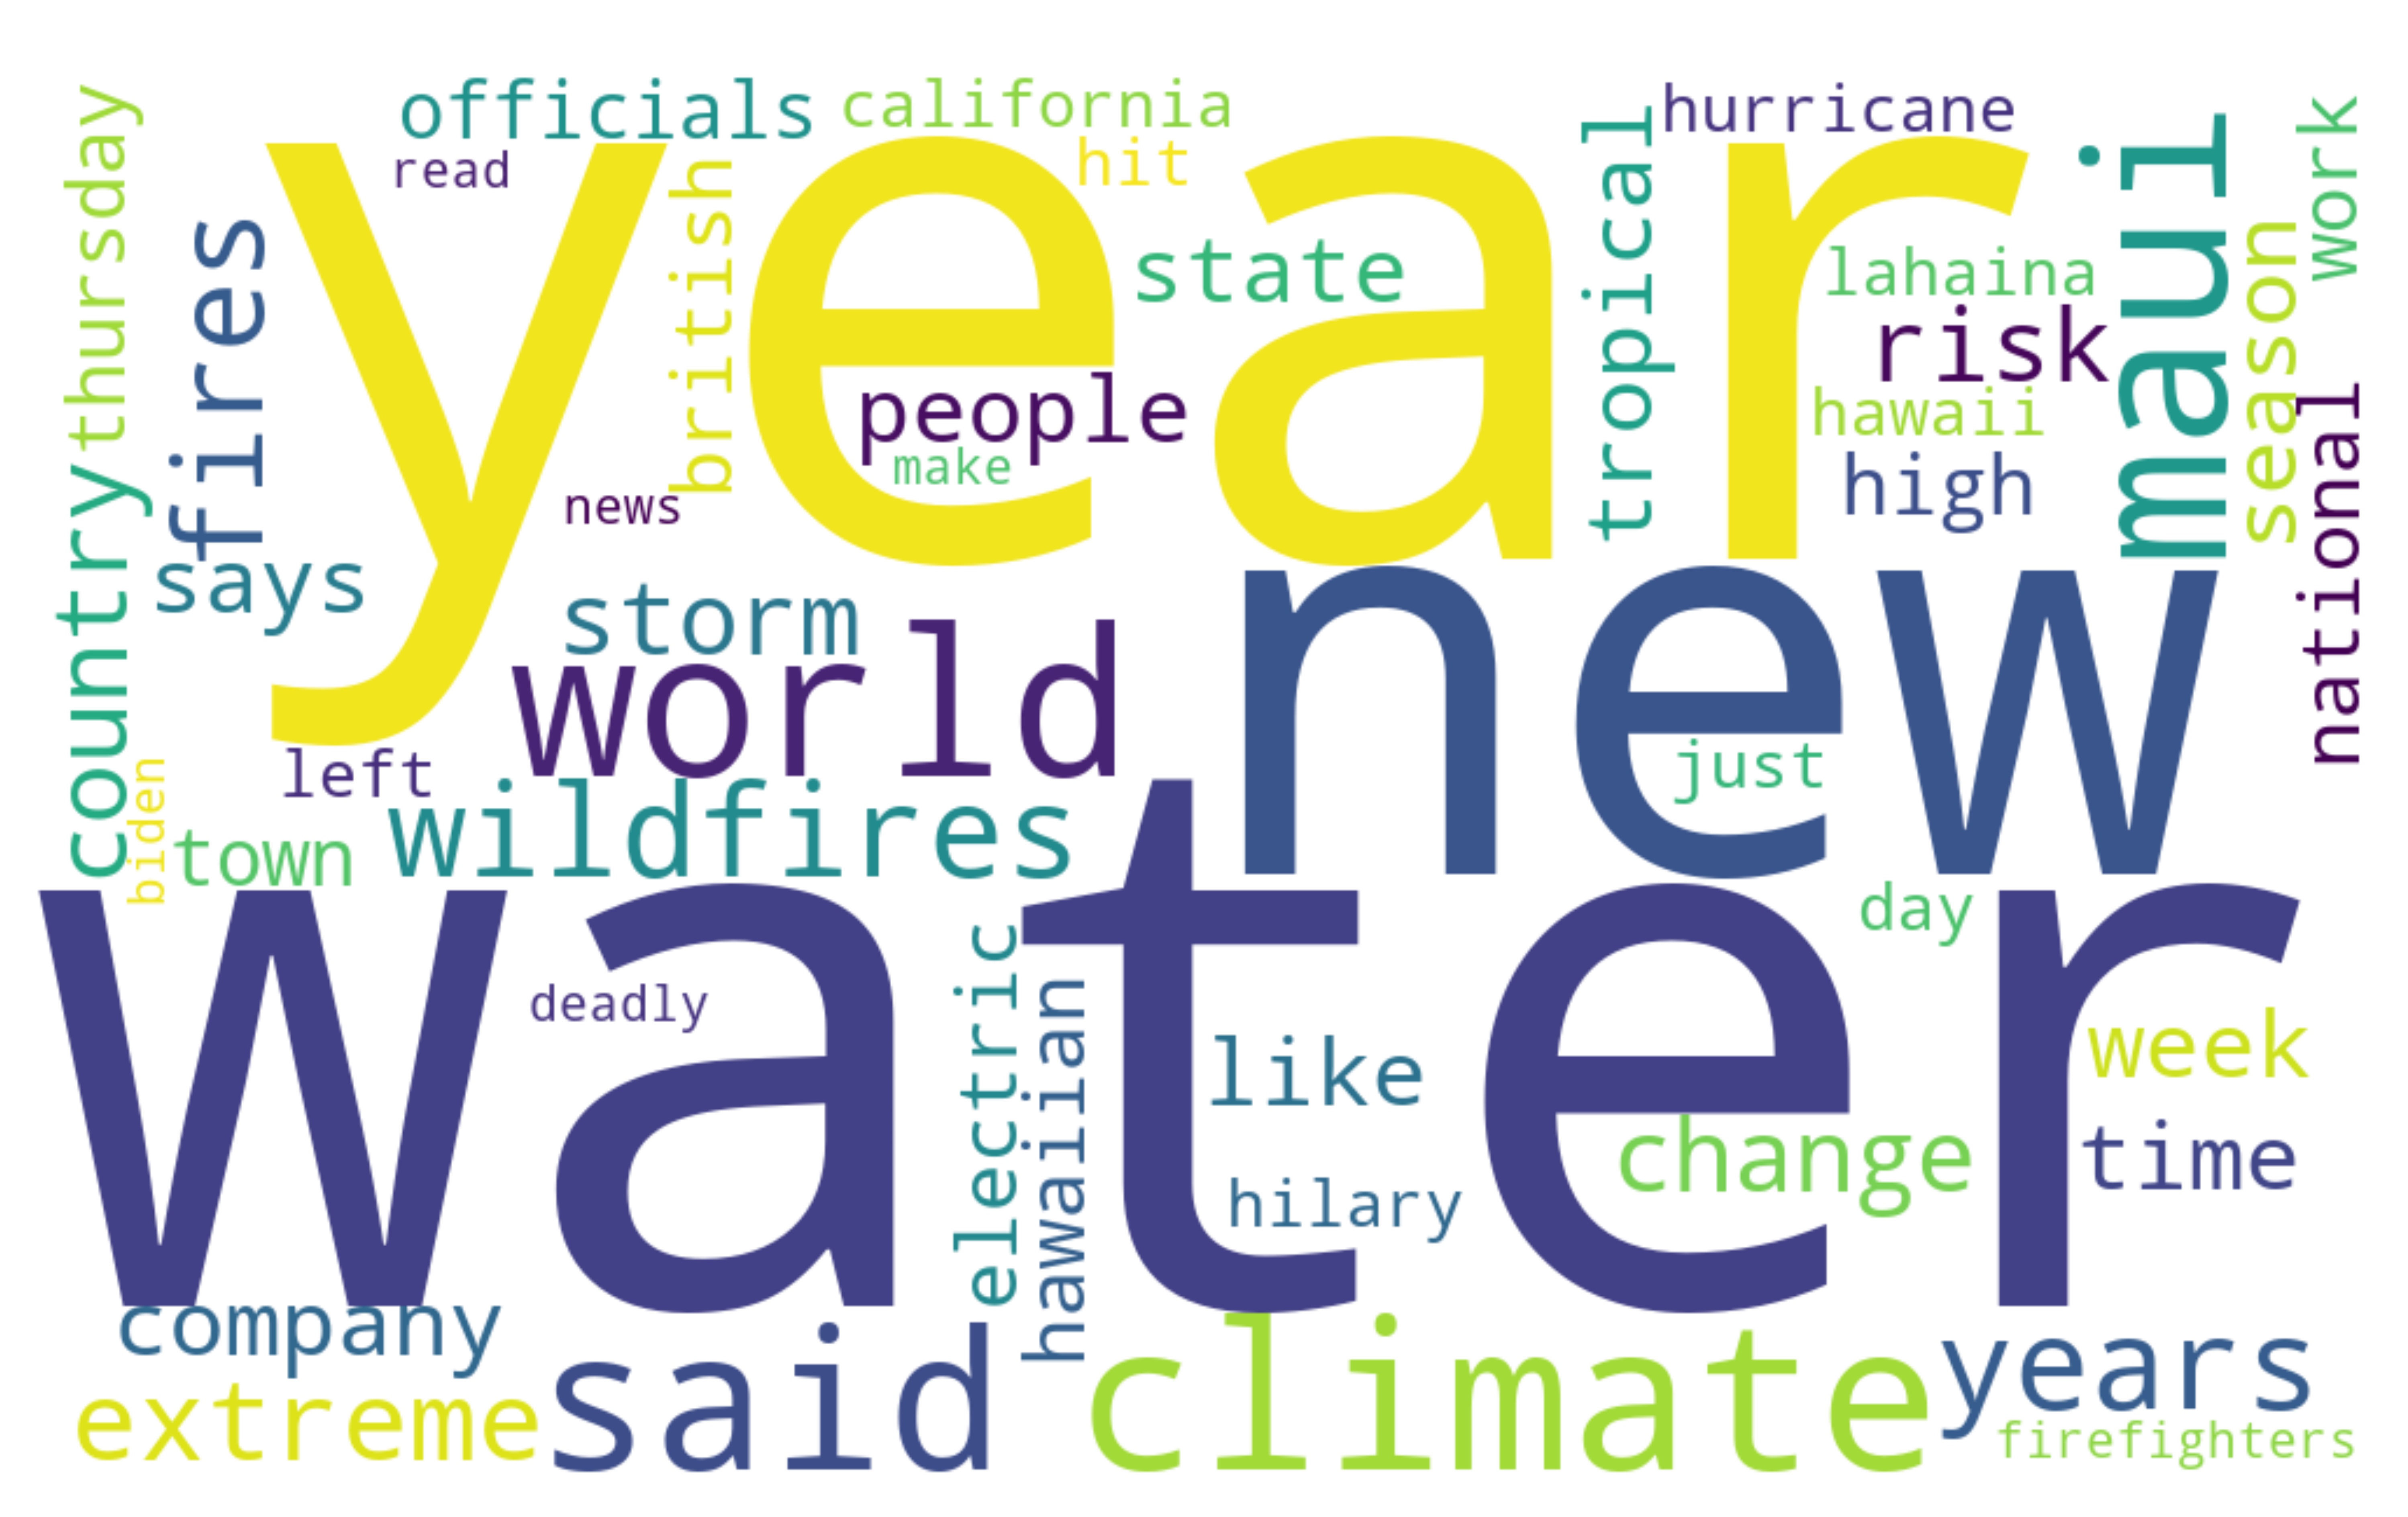
News API Word Cloud – drought
News Word Cloud
The above images are two of the topics that were chosen to inspect the gathered new article headlines. These and the other word cloud offer visually intuitive way to distill and comprehend key themes and trends of the textual data surrounding the topics of wildfires and drought. At a quick glance one is able to interpret the massive amount of discussion that has focused around Maui, water, different political officials, and the discussion of timeline with use of the word “year” and “years”. Based on this exploratory analysis of the New API data, it is wise to look further into the relationships between wildfires, drought, water, locations, and timelines.
A Glimpse into Wildfires Frequency and Acres Burned 2000 to 2022
General Introduction to the Variables
Given the monthly summary values of ‘Acres Burned’, ‘Acres Burned per Fire’, and ‘Number of Fires’, below are some exploratory data analyses delving into the distribution of fires and the acres consumed by them over time. The goal is to be able to formulate questions and ideas about the possible trends or outliers that are worth of future analysis.
In data analytics a great way to begin EDA of a new dataset is to get a broad overview of the relationships between the variables. This is what we can see in the image below.
Pair Plot of US Wildfires frequency and severity in acres burned by month and year

Here we can see a strong correlation between ‘Acres Burned’ and ‘Acres Burned per Fire’ (somewhat expected). This relationship is to be expected as an acre burned by a single fire is a subset of the total acres burned. This is observation that will be necessary to consider when developing a model in the future. Another quick visual observation that this pair plot provides is the general shape of the different distributions. It may be important to note that these are aggregate over all the months and years, so they may be misleading. Further distribution plots below will give a deeper understanding into the distributions of these three quantitative values. That said, there is a clear positive skew for the variables ‘Acres Burned’ and ‘Acres Burned per Fire’. This may be caused by a few years having outliers of extremely high area of burned land. ‘Number of Fires’ is slightly less skewed, meaning that there is more consistency in the number of fires spread. A quick glance at the boxplots reveals that there exists months that act differently in their values of the three variables.
Continuing the exploratory data analysis, now it is time to look a little closer into the distributions of the variables on a deeper level.
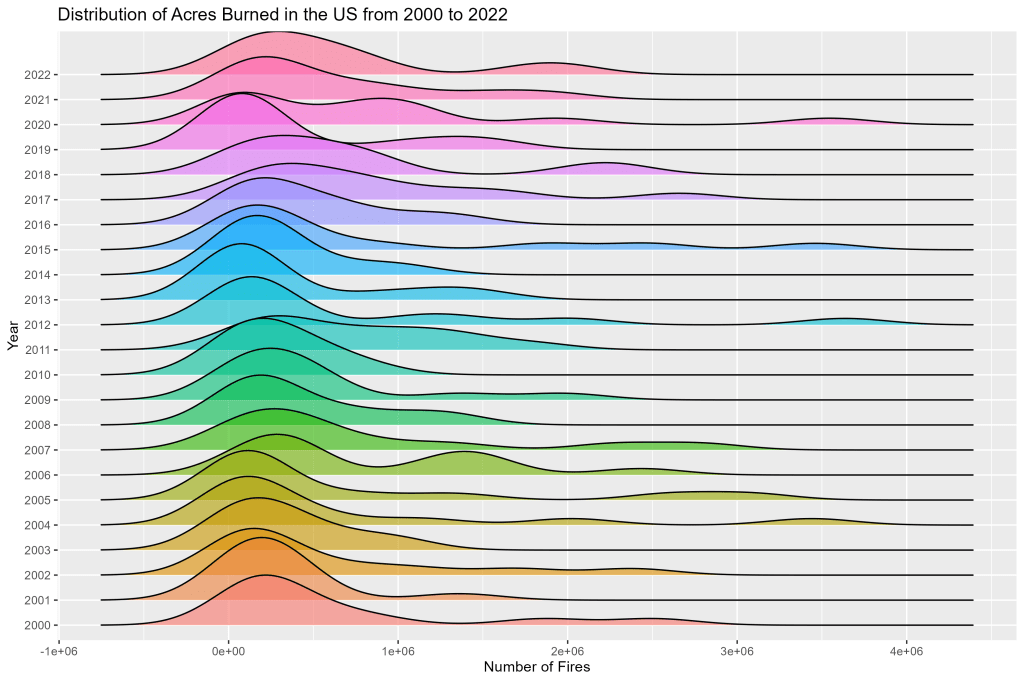
Distribution of Acres Burned in the US from 2000 to 2022
Distribution of Acres Burned per Fire in the US from 2000 to 2022

Number of Fires in the US from 2000 to 2022
As we guessed from the aggregated density graphs the ‘Acres Burned’ and ‘Acres Burned per Fire’ are distributed with a positive skew (this raises a red flag about using mean as the only measure of center). Also, the ‘Number of Fires’ densities have a larger spread. The “bumpiness” of the ‘Number of Fires’ graphs might be the result of certain months having higher trends. For example in the density of ‘Number of Fires’ for the year 2000 we see two distinct peaks. This might be the result of two common levels of fires that year (lots and small). What is also worth noting in the three plots above is that there a significant peaks in the far right values. This hints to there being some months that have a distinctly higher amount of fires than the other months. It may be interesting to look into these months are try and see the cause of their extreme high values.
Another look into the densities over time is for the two acres burned plots. In more recent years of spread of the densities have increased. In the years 2000 to 2005 there was a consistent trend of a distinct peak in the low end of acres burned. However, in the year 2011, 2016, 2017, 2018, 2020, and 2021 it can be seen to have more spread in these densities. This is going to show that these higher values of aces burned are becoming less “unique”. Where in 2004 the far right peak stands alone (outliers still to be determined), in 2018 this similar value feels closer to that average acres burned.
Discussing the changes over time in the graphs above we can see that for ‘Number of Fires’ the spread of the densities shrink and shift to a lower value. This demonstrates that the number of fires are more consistent across the different months in later years to that of the early 2000s.
Number of Fires each year from 2000 to 2022
The above boxplot shows what we were assuming that the spread of the number of fires does indeed “shrink” over time. It would be interesting to perform further research into the reason why, the spread has decreased over time, and if it is human intervention or environmental reasons.
To look closer at the trends of ‘Acres Burned’ and ‘Number of Fires’ refer to the scatter plots with regression lines below.
Total Acres Burned per Fire in the US – years 2000 to 2022
Total Number of Fires in the US – years 2000 to 2022
The above plots demonstrate more into the trend of acres burned and number of fires in there total values as apposed to the spread as demonstrate in the density ridge plots. How these scatter plots were made was that each year the variables values were summed up over the months to show what the total number of the variable (acres burned or number of fires respectively) for that year. As one can see, there is a noticeable increase in ‘Acres Burned’ from 2000 to 2022 but a decrease in the ‘Number of Fires’. This leads to an observation that even though the number of fires have decreased over the past two decades, the severity of each of these fires has increased. So much so that the smaller number of fires is producing more burned area than the larger number of fires in total. This can be quite alarming as it reflects on the “out of control” nature that fires can have. Further understanding might help with protecting people and the environment in the US from these wildfires that are burning more and more than previously.
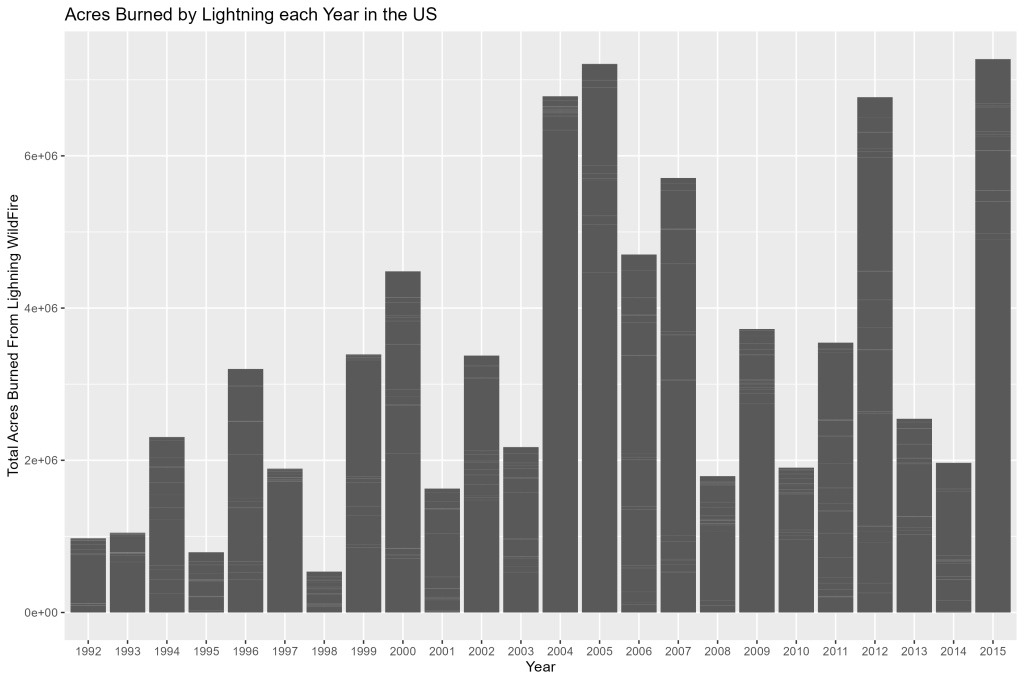
Acres Burned from Fires started by Lightning in the US 1992 to 2015
In the above bar chart, one can see that not only have the number of acres burned increased throughout the years, but there has also been an increase in acres burned from specific causes. Fires are started in many ways, lightning is one of the more famous “natural” ways. Since lightning is an unavoidable weather pattern, it is important to be aware of these kinds of trends. Further analysis should be performed to see if the increase in acres burned has been the result of more lightning or other factors such as poor land management and drought.
To continue the exploration into the wildfire dataset, summary statistics showed the maximum and minimum years/months for the three variables of interest. Looking a little more closely at these extremes may help us gain a better understanding of the pattern around wildfires.
Maximums and Minimums – Looking for Trends in Months
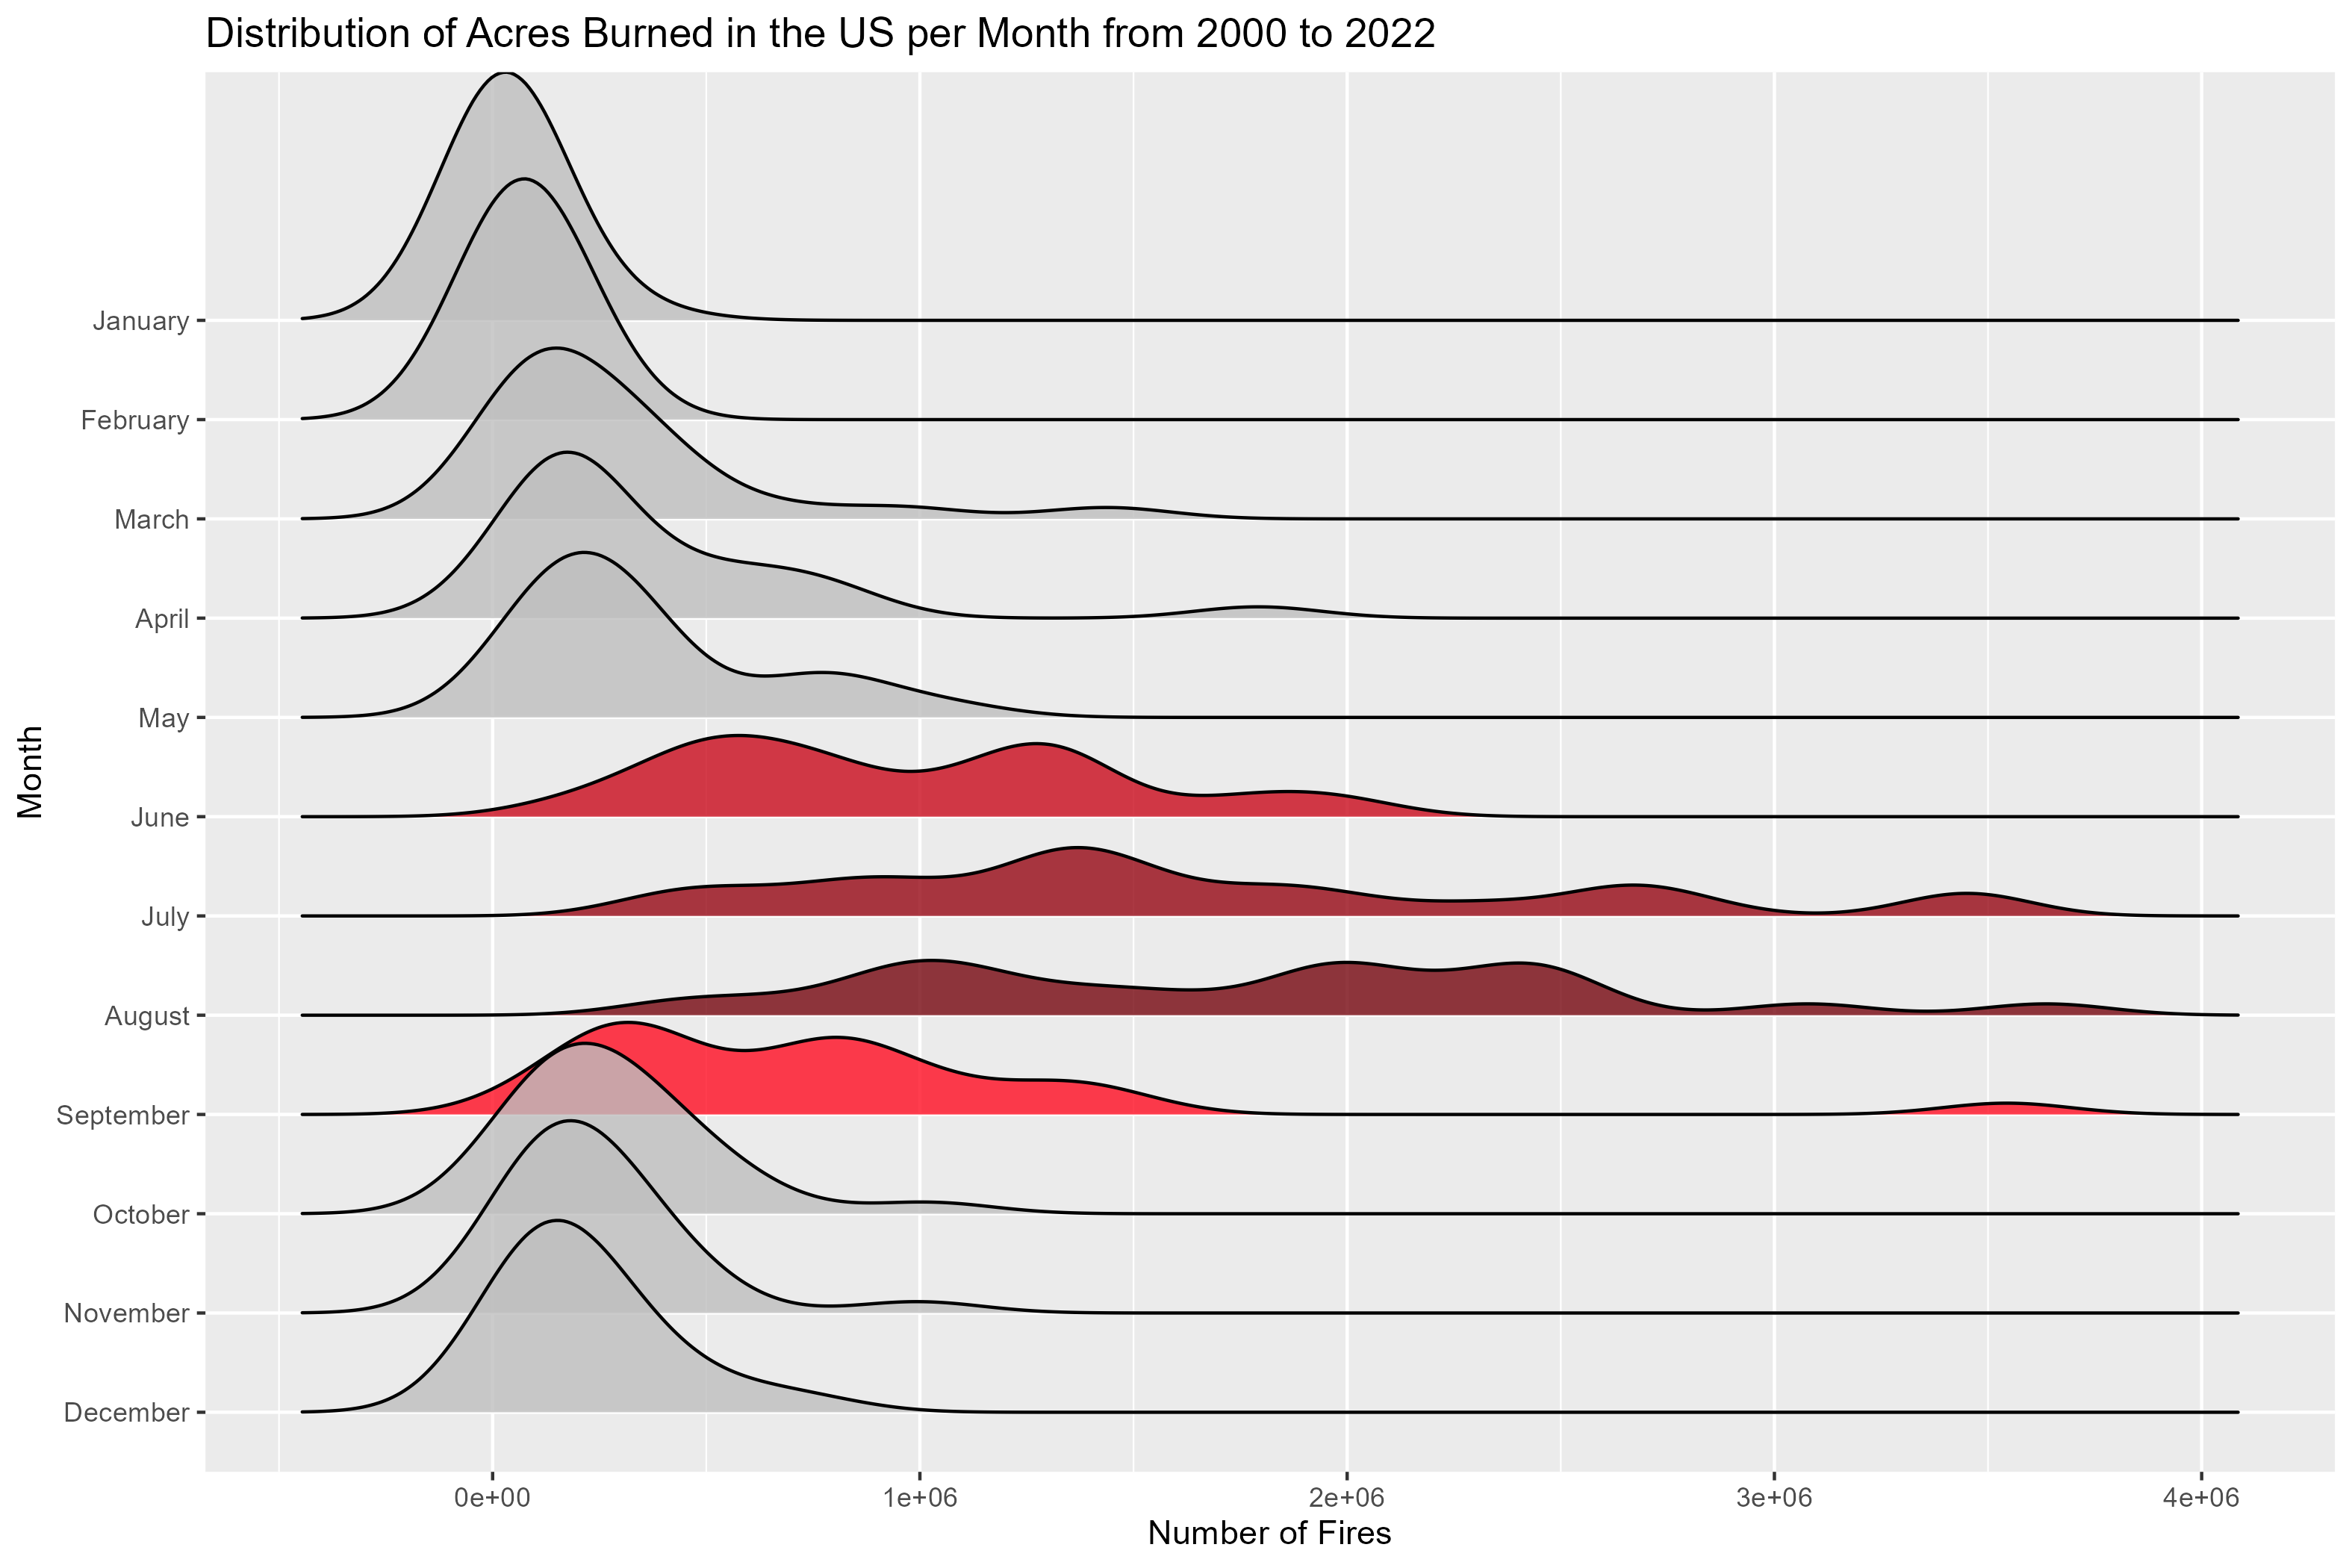
Distribution of Acres Burned in the US per Month from 2000 to 2022
Total Acres Burned averaged 2000 to 2022:
- August : 1758388.3 acres
- July : 1651952.9 acres
- June : 969275.1 acres
- September: 791310.7 acres
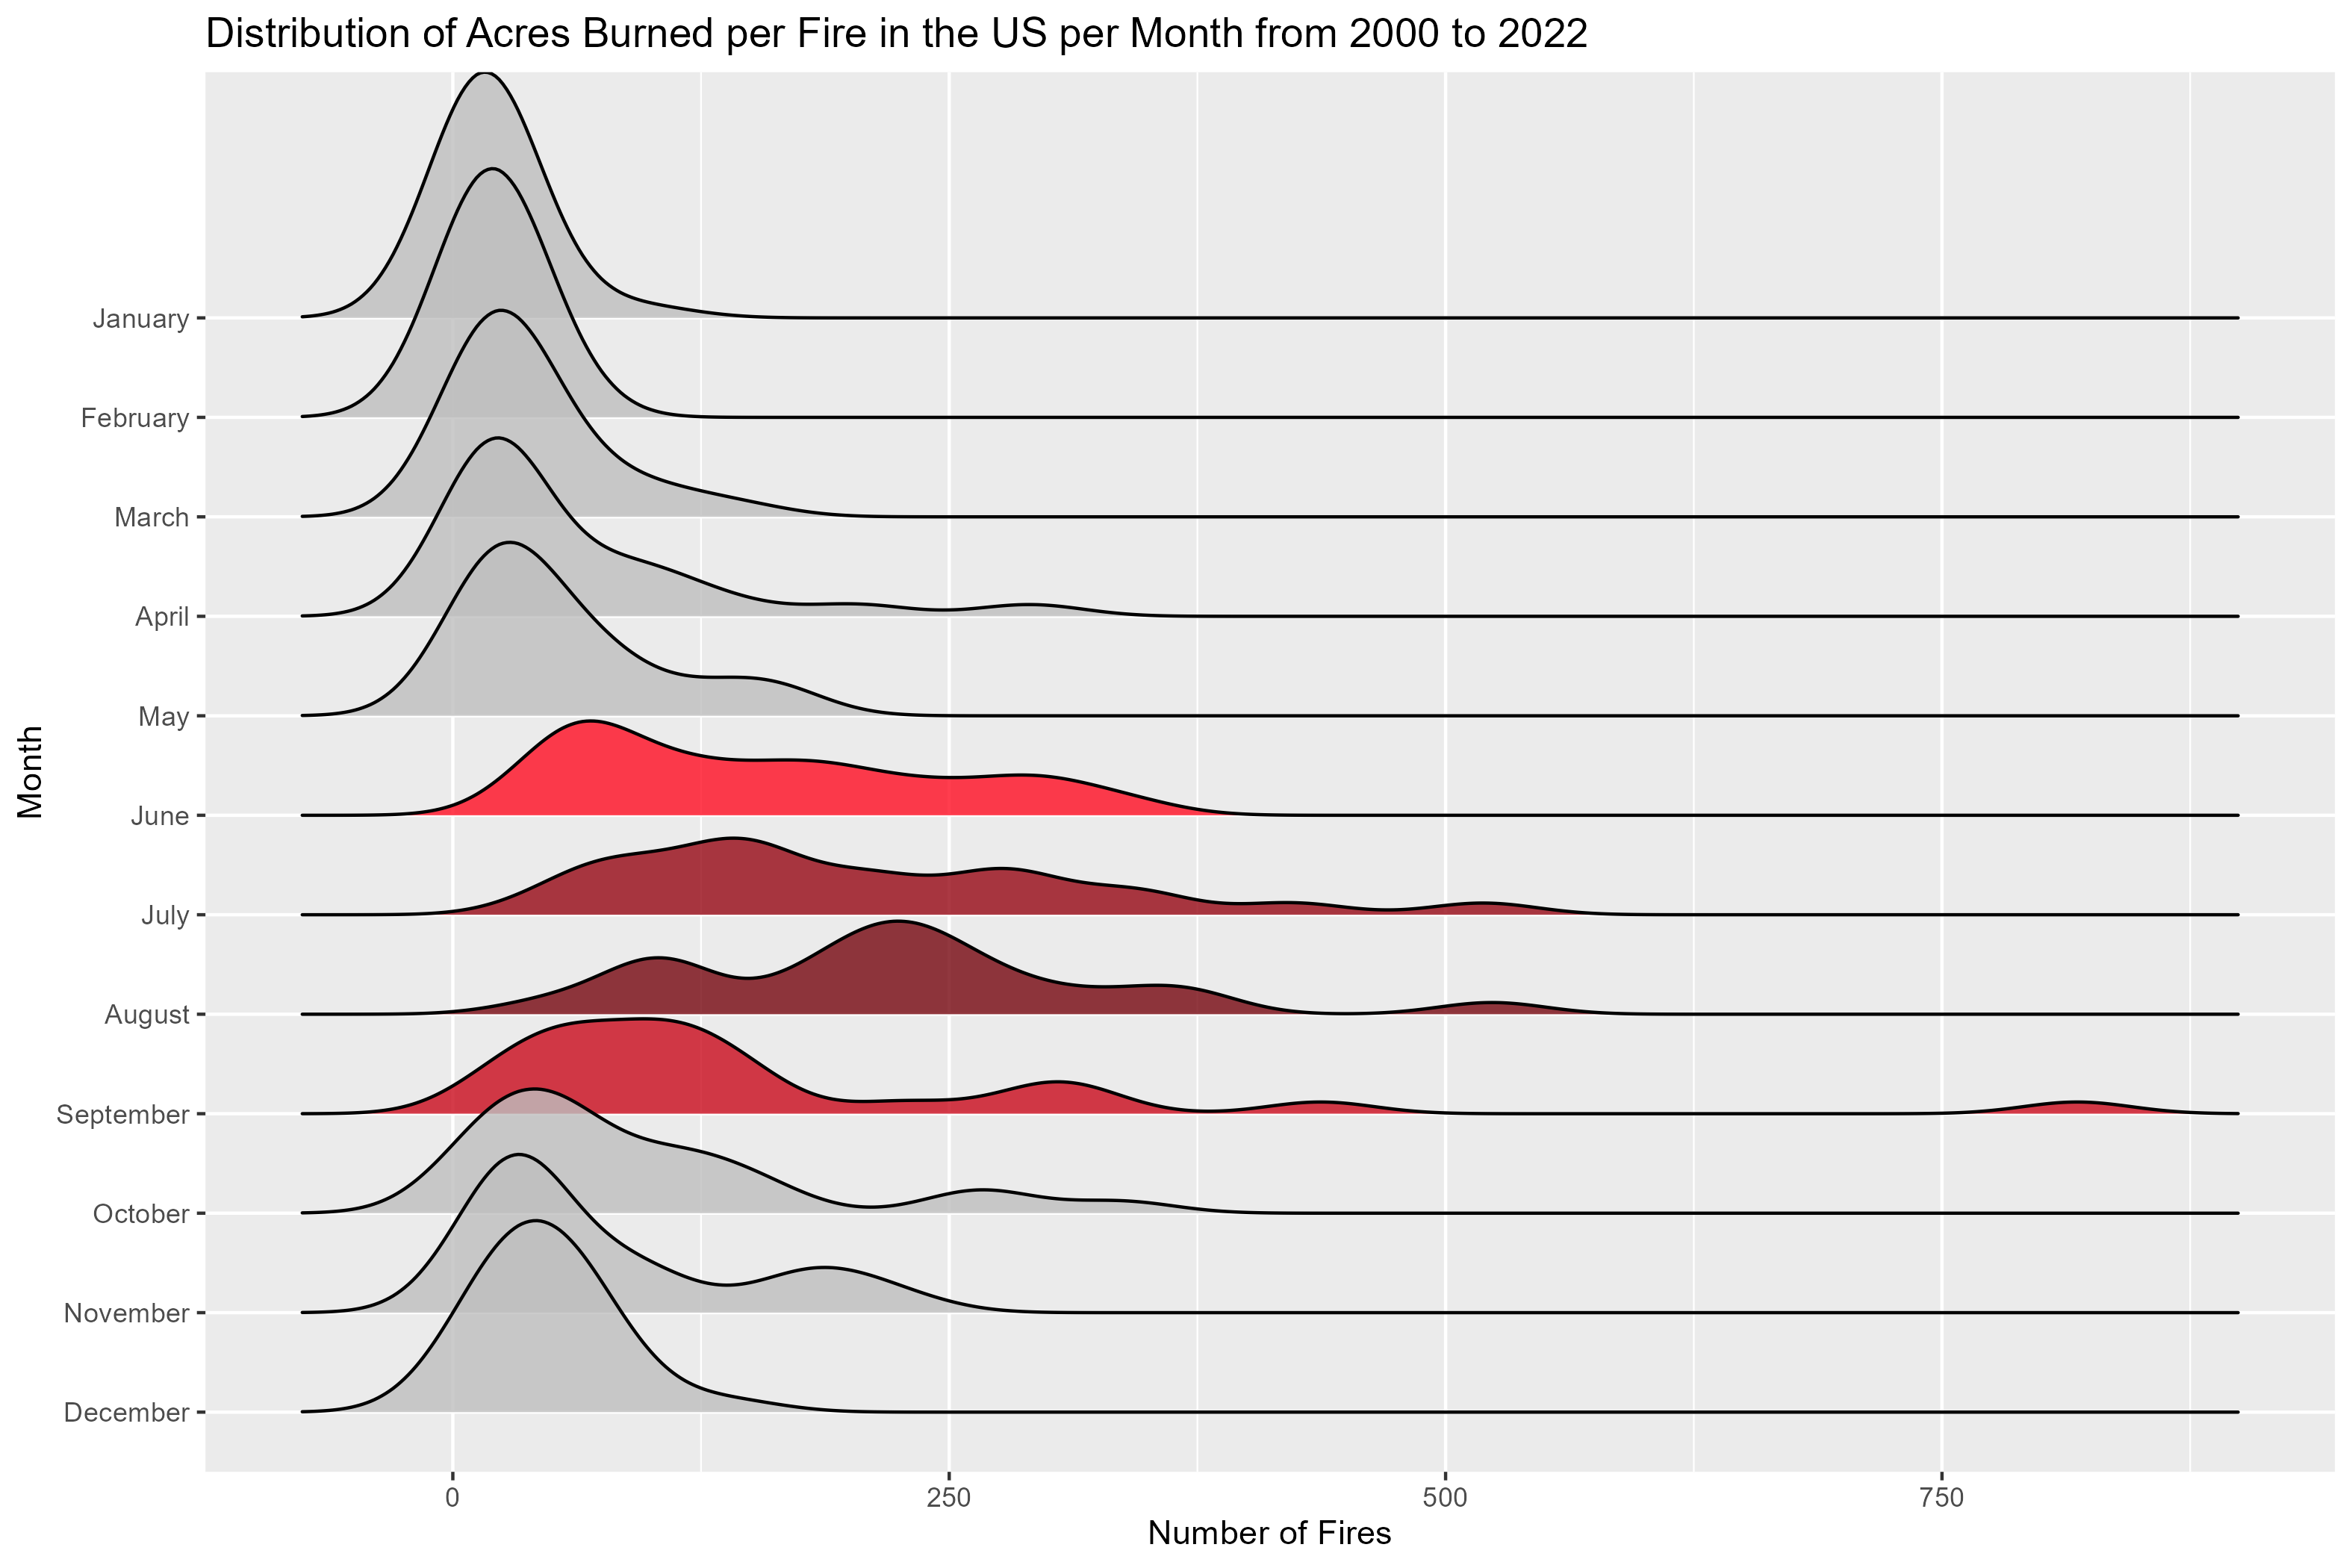
Distribution of Acres Burned per Fire in the US per Month from 2000 to 2022
Total Acres Burned per Fire summed over 2000 to 2022:
- August : 222.2 acres
- July : 207.2 acres
- September : 167.5 acres
- June : 156.3 acres

Distribution of Acres Burned in the US per Month from 2000 to 2022
Total Number of Fires summed over 2000 to 2022:
- July : 194283
- August : 187921
- May : 170380
- April : 169319
- March : 164789
The above density plots represent that distributions of the three variables (‘Acres Burned’, ‘Acres Burned per Fire’, ‘Number of Fires’) for each of the months. As one can see in the acres burned ridge plots there are distinct months in the year that have more acres burned than others. These have been highlighted with shades of red (darkest meaning the highest average acres burned month for the time span recorded). As one might note, in the northern hemisphere where the United States of America is geographically located has Summer between June 21st and September 23rd. Since there is such a noticeable change in the distribution of acres burned during these months, an analysis into weather and water content may be extremely useful in building a stronger knowledge on the situation at hand.
Another noteworthy observation is the number of fires is a little more consistent between months, but still has a significant increase in its center and spread in the months highlighted in red. For the number of fires, the darkest blue and the darkest red demonstrate the extreme ends of the number of fires. So January has a history of having less total fires throughout the past two decades and July has the most. It is interesting to note that that January and February have the least amount of fires and the it jumps up in March and the starts to slow down in October. Also within the distributions of the number of fires one can see that there is a lot of variation in December. This is interesting because for the acres burned variables the colder months have fairly normal distributions and gain more and more of a skew as the months change to summer. Yet, for fall into winter months, one can still see lots of variation in the number of fires. Further research can give a better understanding of why this may be. This same observation can be seen in the boxplot below.
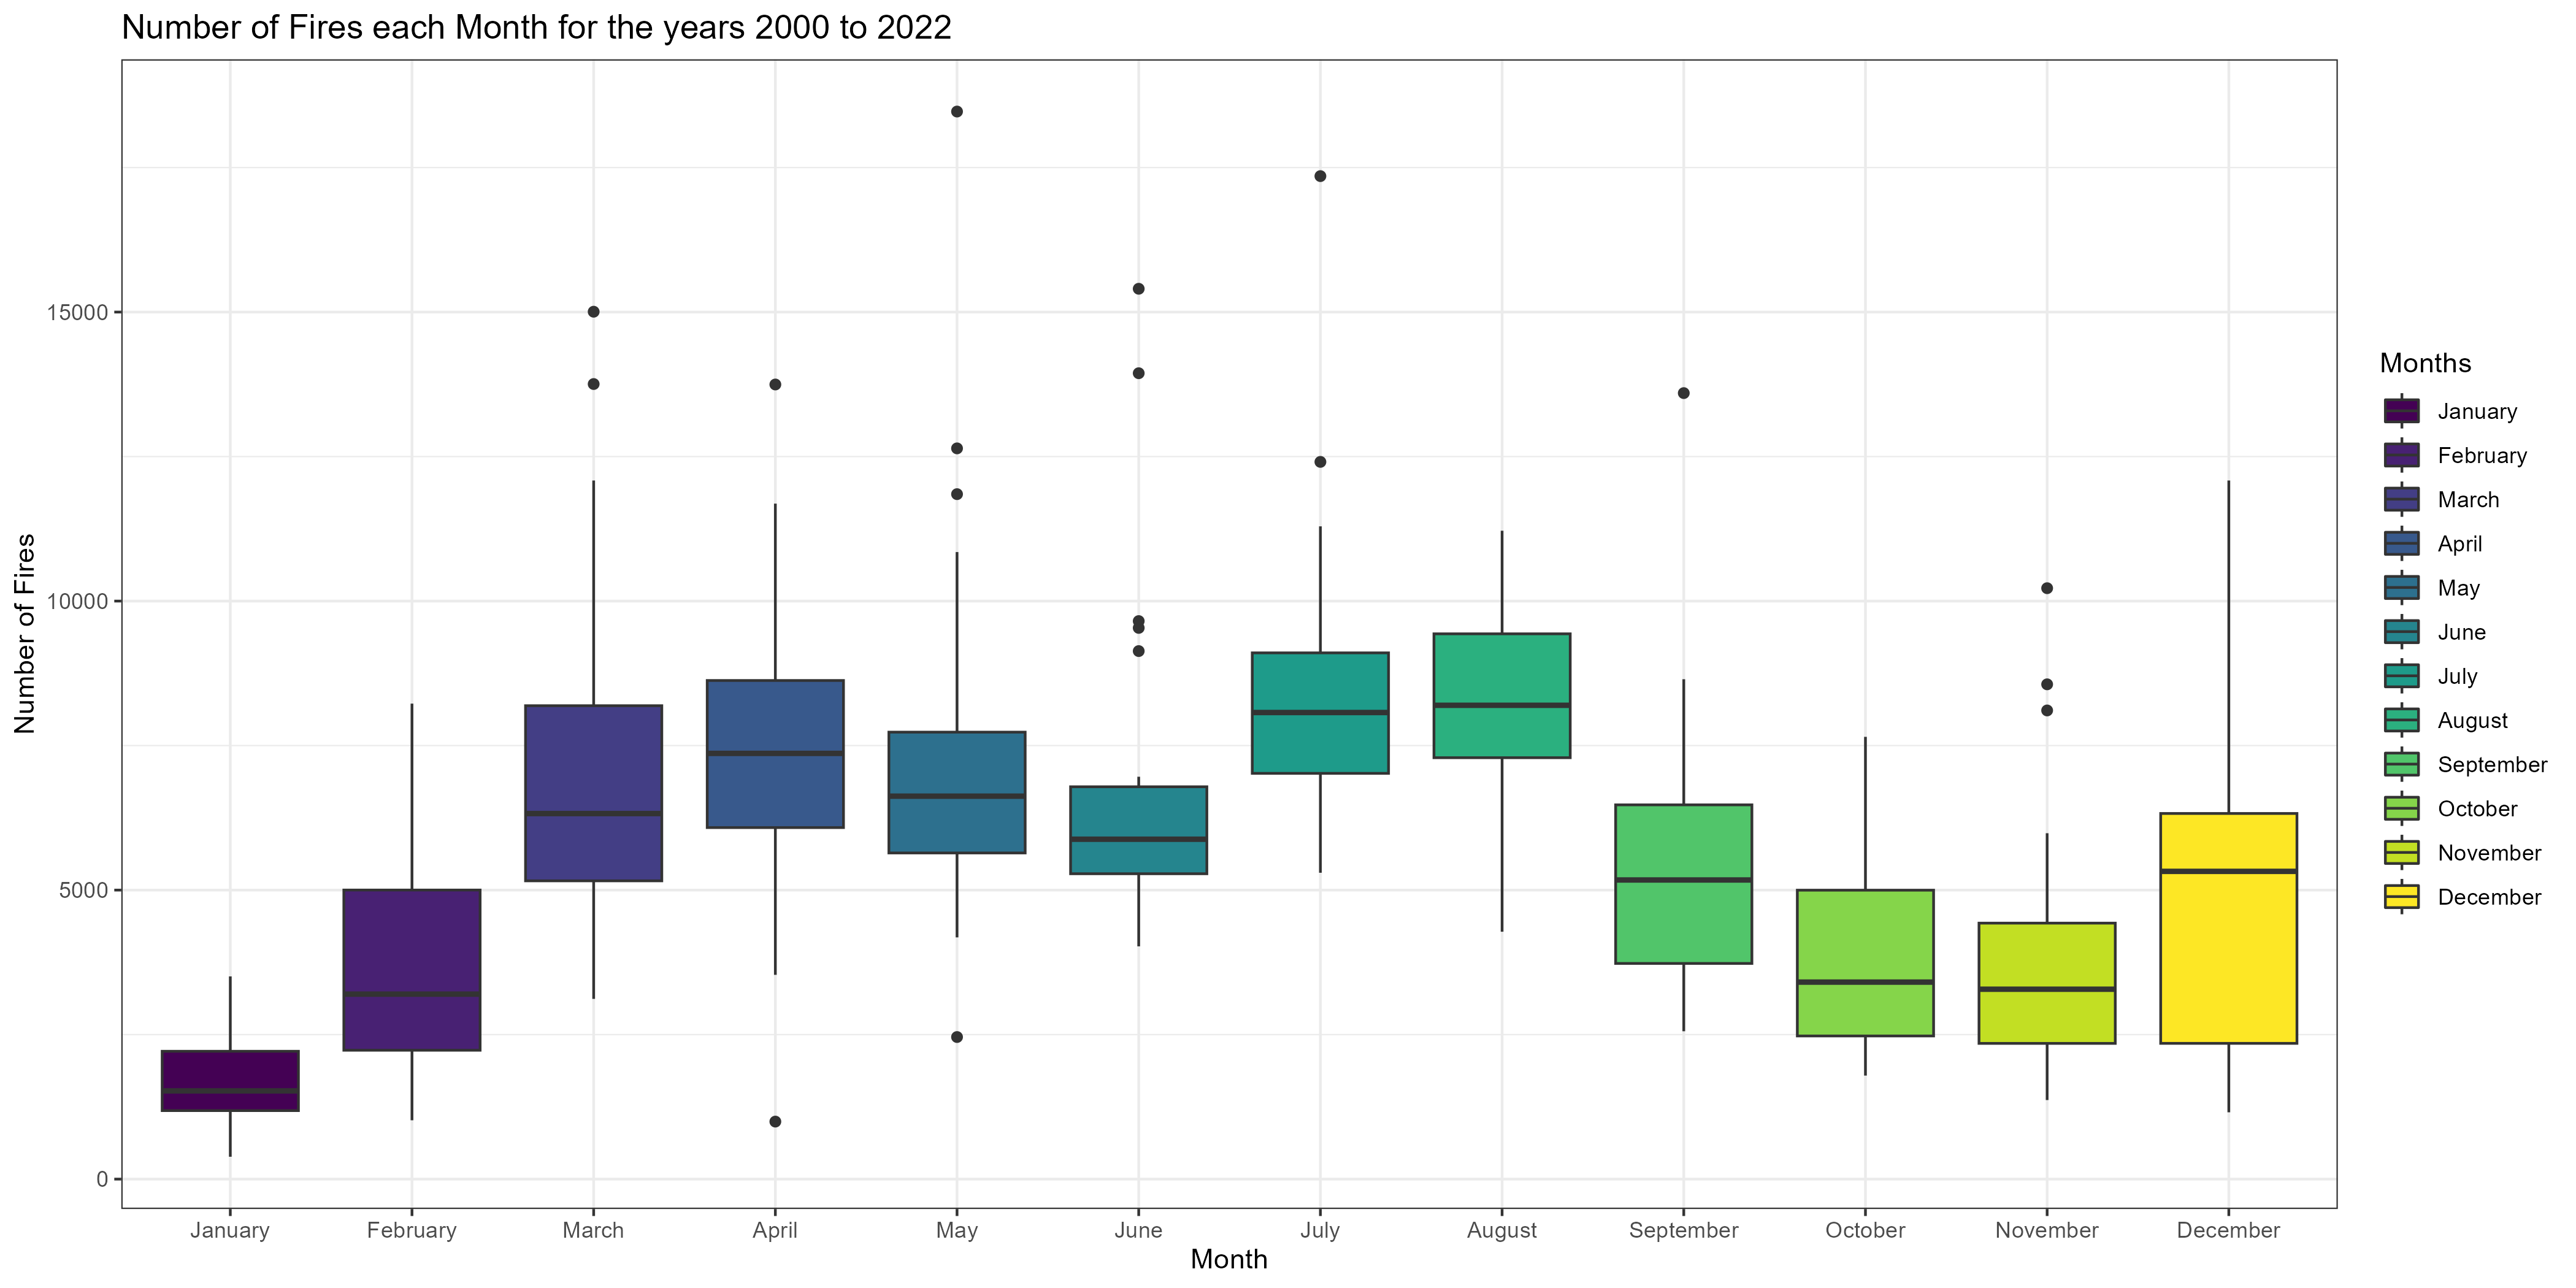
Number of Fires Each Month for the year 2000 to 2022
Here the boxplot develops a clearer story of how the number of fires quickly increases in spring, settles at a higher level, and then drops off as it moves towards winter. Then shocking a lot more fires in December. One curiosity to look into is Christmas fires. Instead of it being a climate drought making trees easier to burn, Christmas trees that have dried out could be adding to the increase in December fires.
Maximums and Minimums – Years
Top 5 Highest and Lowest Acres Burned in the Year Split by Month
Darkest Red to Darkest Blue – Highest 5 Years for Acres Burned in red and Lowest 5 Years for Acres Burned in blue. The purpose of this plot is showing which how these two extremes differ in there distributions over the span of the year. 2020 holds the highest amount of acres burned between the year 2000 and 2022 in the US, one can see that a significant amount of this space happened in the months July through September. It is also important to note that September 2020 was significantly larger than the next highest burn year’s of 2015, but that the July 2015 had significantly more acres burned than July 2020. It is even worth mentioning that three of the bottom 5 have higher acres burned in July compared to the year 2020’s July.
It is also important to note that for months with smaller acres burned there is less of a difference between the top 5 and bottom 5, but in months with more burn the differences start to be more noticeable, especially in March, July, and September.
Top 5 Highest and Lowest Number of Fires in the Year Split by Month
Here one can see that the 5 highest number of fires and 5 lowest are not the same years as for the acres burned. As noted above 2020 had the most acres burned in the last two decades, but here we see that 2020 is one of the lowest – the fourth lowest. Which means that the fires in 2020 may have be low in the number of fires, but as seen in the first plot months such as August and September are severe per fire. Another point to observe is that for the number of fires, it stays fairly consistent in the 5 lowest being noticeably lower than the the five highest (except for January and November). This plot stays consistent with the trends seen in the boxplot “Number of Fires Each Month for the year 2000 to 2022” as described above, where the number of fires increase in March and then stays somewhat steady in summer then decreases in the fall and winter.
