Association Rule Mining
Overview
Imagine you have a magic bag of candies, and you want to figure out which candies taste the best together. So, you start looking at the candies you’ve eaten and write down which ones you ate together often. Let’s say every time you had a red candy, you also had a blue candy. You write it down as a rule: ‘When I eat a red candy, I usually eat a blue candy too.’ Then, you notice that every time you eat a yellow candy, you also have a green candy. So, you write another rule: ‘When I eat a yellow candy, I usually eat a green candy too. These rules help you find out which candies go well together, just like picking different combinations of your favorite outfits. Association rule mining is like using your magic candy bag to find out which candies are often grouped together creating the best tasty combinations.
Association rule learning is a rule-based machine learning technique used to uncover intriguing relationships between variables in extensive databases1. Association Rule Mining (ARM) proves highly valuable in uncovering patterns, relationships, and interconnections among items or attributes within datasets. Its versatility extends to numerous domains, including market basket analysis, recommendation systems, and in the scope of this project – looking for connections of descriptions of different causes of fires starting and media attention around fires and weather.

Measures in Association Rule Mining
Support measures the frequency or occurrence of a particular itemset in the dataset. It indicates how often a specific combination of items appears together. High support values imply that the itemset is frequent, while low support values suggest infrequent itemset occurrences.


Confidence measures the strength of association between two items or itemsets. It calculates the probability that when one item is present, another item will also be present. Higher confidence values indicate a stronger association.
Lift measures the strength of the association between two items or itemsets compared to what would be expected by chance. A lift value greater than 1 suggests a positive association, indicating that the two items are more likely to occur together than independently. A lift value equal to 1 implies no association (independence), while a lift value less than 1 suggests a negative association.

Rules in Association Rule Mining
Association rules are typically expressed in the form of “if-then” statements, where one itemset (the antecedent) implies the presence of another itemset (the consequent). For example, going back to the candy example above, if you draws a red candy, then you would draw a blue candy next. These rules are often denoted by and arrow such as: eat red candy => eat blue candy. This can be seen in the definition of the three measures above.
Apriori Algorithm
The Apriori algorithm, introduced by R. Agrawal and R. Srikant in 1994, is designed to discover frequent itemsets in a boolean association rule dataset. It derives its name, “Apriori,” from its reliance on prior knowledge about frequent itemset properties. The algorithm employs an iterative approach or level-wise search, utilizing k-frequent itemsets to uncover k+1 itemsets.2 This approach is rooted in a statistical understanding of set and superset probabilities. Its core efficiency principle revolves around the concept that if event A falls below the minimum support threshold, then event B, which is a superset of A, will likewise fall below this threshold. Consequently, there’s no need to scrutinize event B. “All non-empty subset of frequent itemset must be frequent” (GeeksforGeeks)3.
- Create Initial Sets: Initially, the algorithm identifies all single items (1-item sets) in the dataset and calculates their support. It then generates candidate sets for the next iteration by combining frequent (k-1)-item sets.
- Prune Infrequent Sets: In this step, the algorithm eliminates candidate sets that do not meet a minimum support threshold. This reduces the search space and focuses on the most relevant sets.
- Repeat: The algorithm iteratively generates candidate sets and prunes them until no more frequent sets can be found or until a specified level of itemset size is reached. The initial itemset only has one element, next iterative it will have two, next three, and so on.
- Generate Association Rules: Once all frequent sets are identified, the algorithm generates association rules based on these sets. It calculates confidence and lift for each rule to determine their significance.
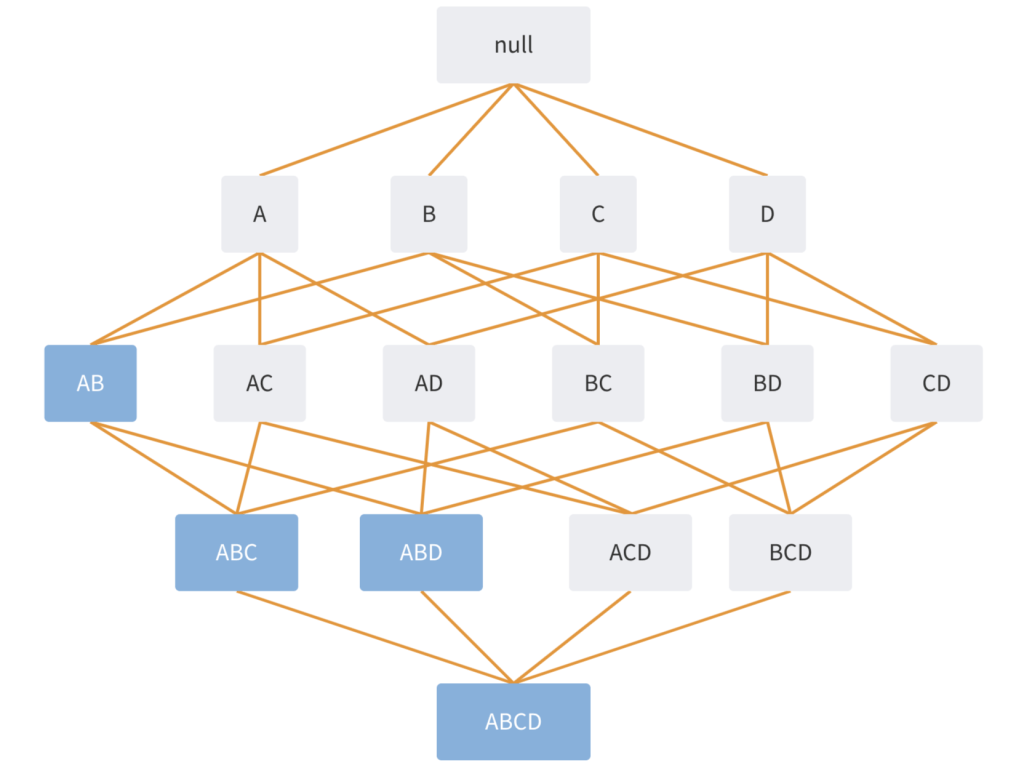
What makes the Apriori Algorithm so effective is the pruning step. A different approach would be to create all possible sets and their possible rules. However including the empty set and all values that would be a total of 2^n possibilities with n being the number of items in the data. For our project the Oregon Wildfires and Weather Cause Comments dataset includes 75 terms. So, we would be making 3.7778932e+22 rules. Therefore by punning out infrequent sets, one can look at only the rules that have a substantial meaning to the data.
In the image one can see that the set AB was determined “infrequent” so ABC ABD and ABCD are also infrequent and therefore do not need to have rules made for them.
Data Prep
In this project section, we will perform association rule mining on textual data sourced from the fire and weather datasets, as previously introduced in the DataPrep/EDA tab of this project. Specifically, our focus will be on analyzing the NewsAPI headlines dataset, which contains headlines related to topics such as “wildfire,” “drought,” “burn,” and “weather”. Additionally, we will incorporate two other datasets for association rule mining analysis. These are from the Oregon Wildfires and Weather dataset, covering the years 2000 to 2022, which includes textual data regarding “cause comments” and “specific causes.” All the data that has been cleaned and transformed into transactional data for ARM can be found on the GitHub repository for the project here.
The objective is to gain insights into the relationships between different topics mentioned in the headlines and to delve deeper into the terminology used to describe the causes of fires.
In the context of Association Rule Mining analyses, it’s essential to utilize transactional data exclusively. Three datasets have been thoughtfully selected for this particular project section: “Oregon Wildfires and Weather Cause Comments,” “Oregon Wildfires and Weather Specific Causes,” and the “NewsAPI headlines” dataset covering topics like “wildfire,” “drought,” “burn,” and “weather,” respectively. Each of these datasets has undergone a meticulous cleaning process, followed by vectorization and transformation into basket data, as outlined in the DataPrep/EDA section of our project.
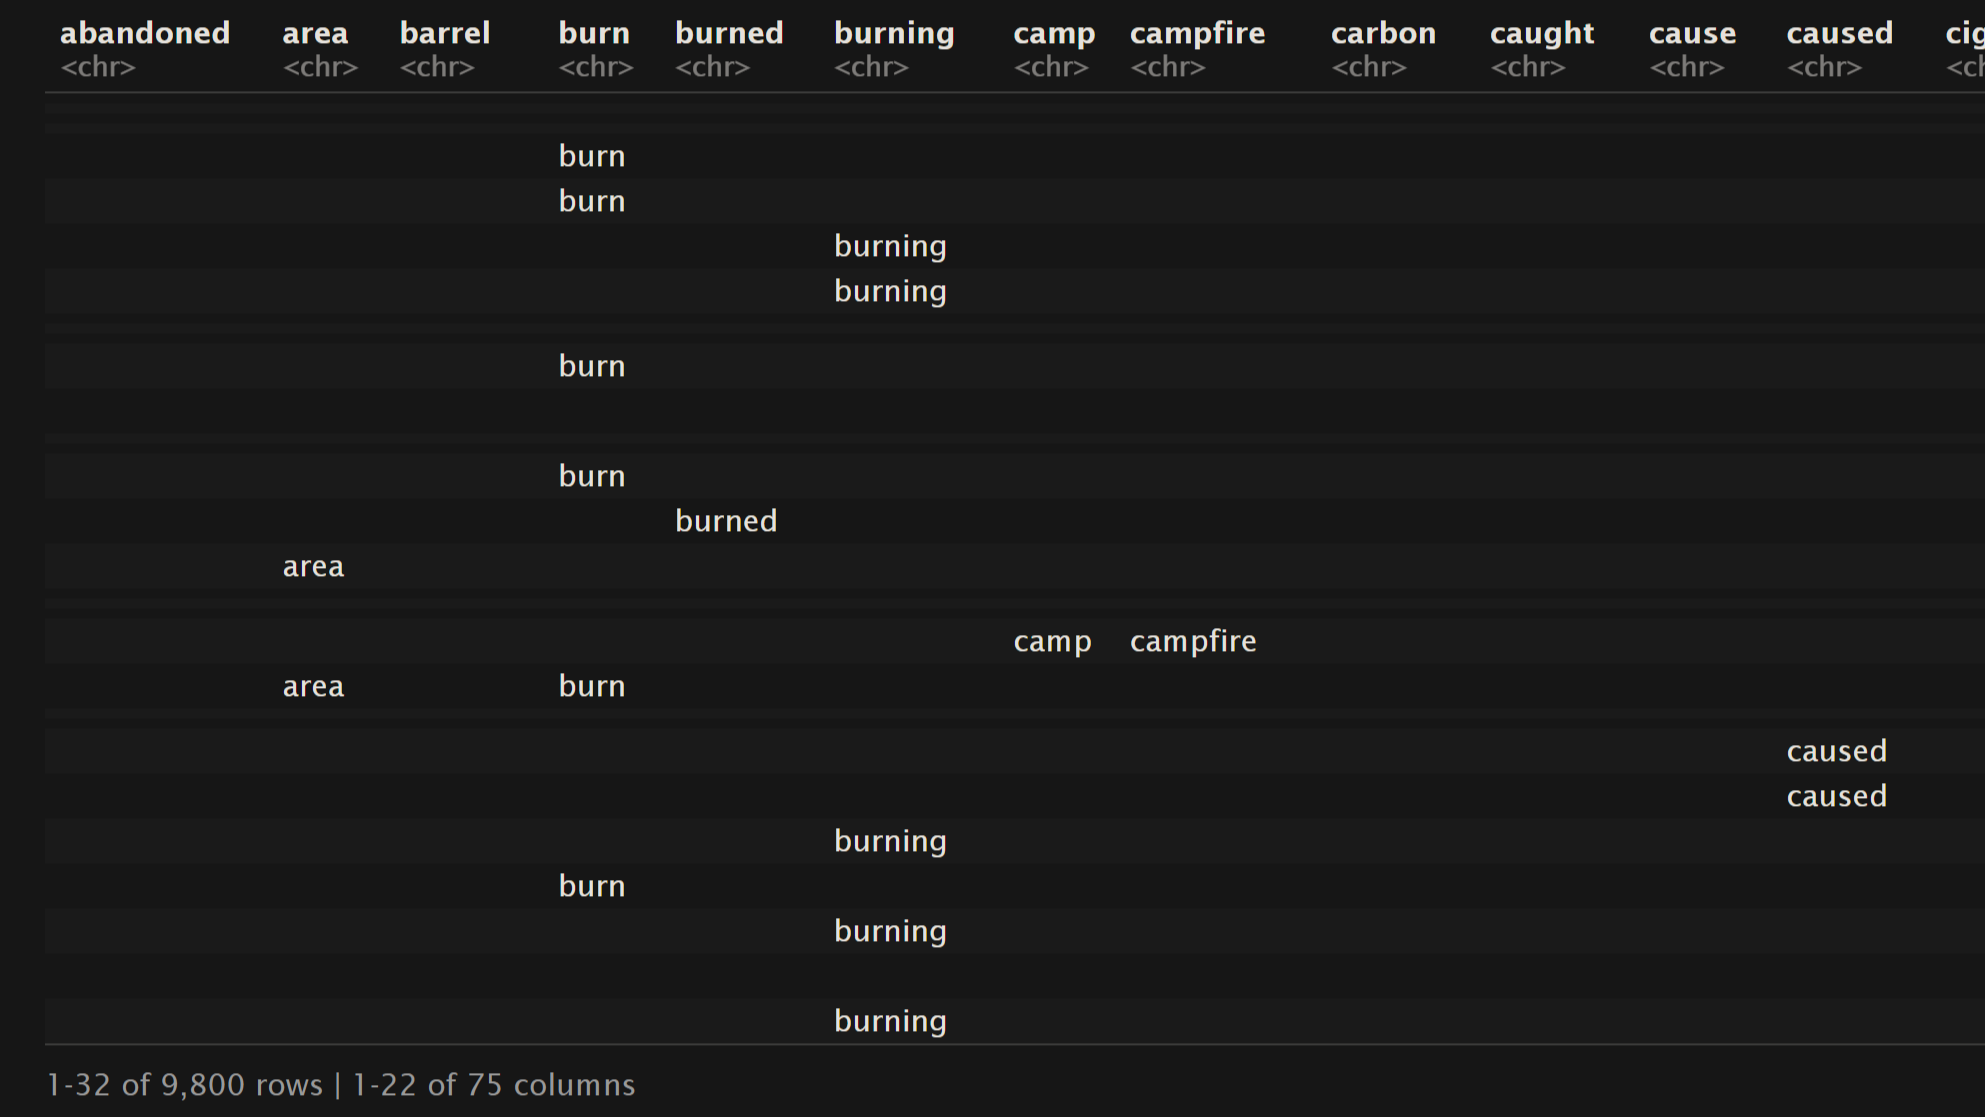
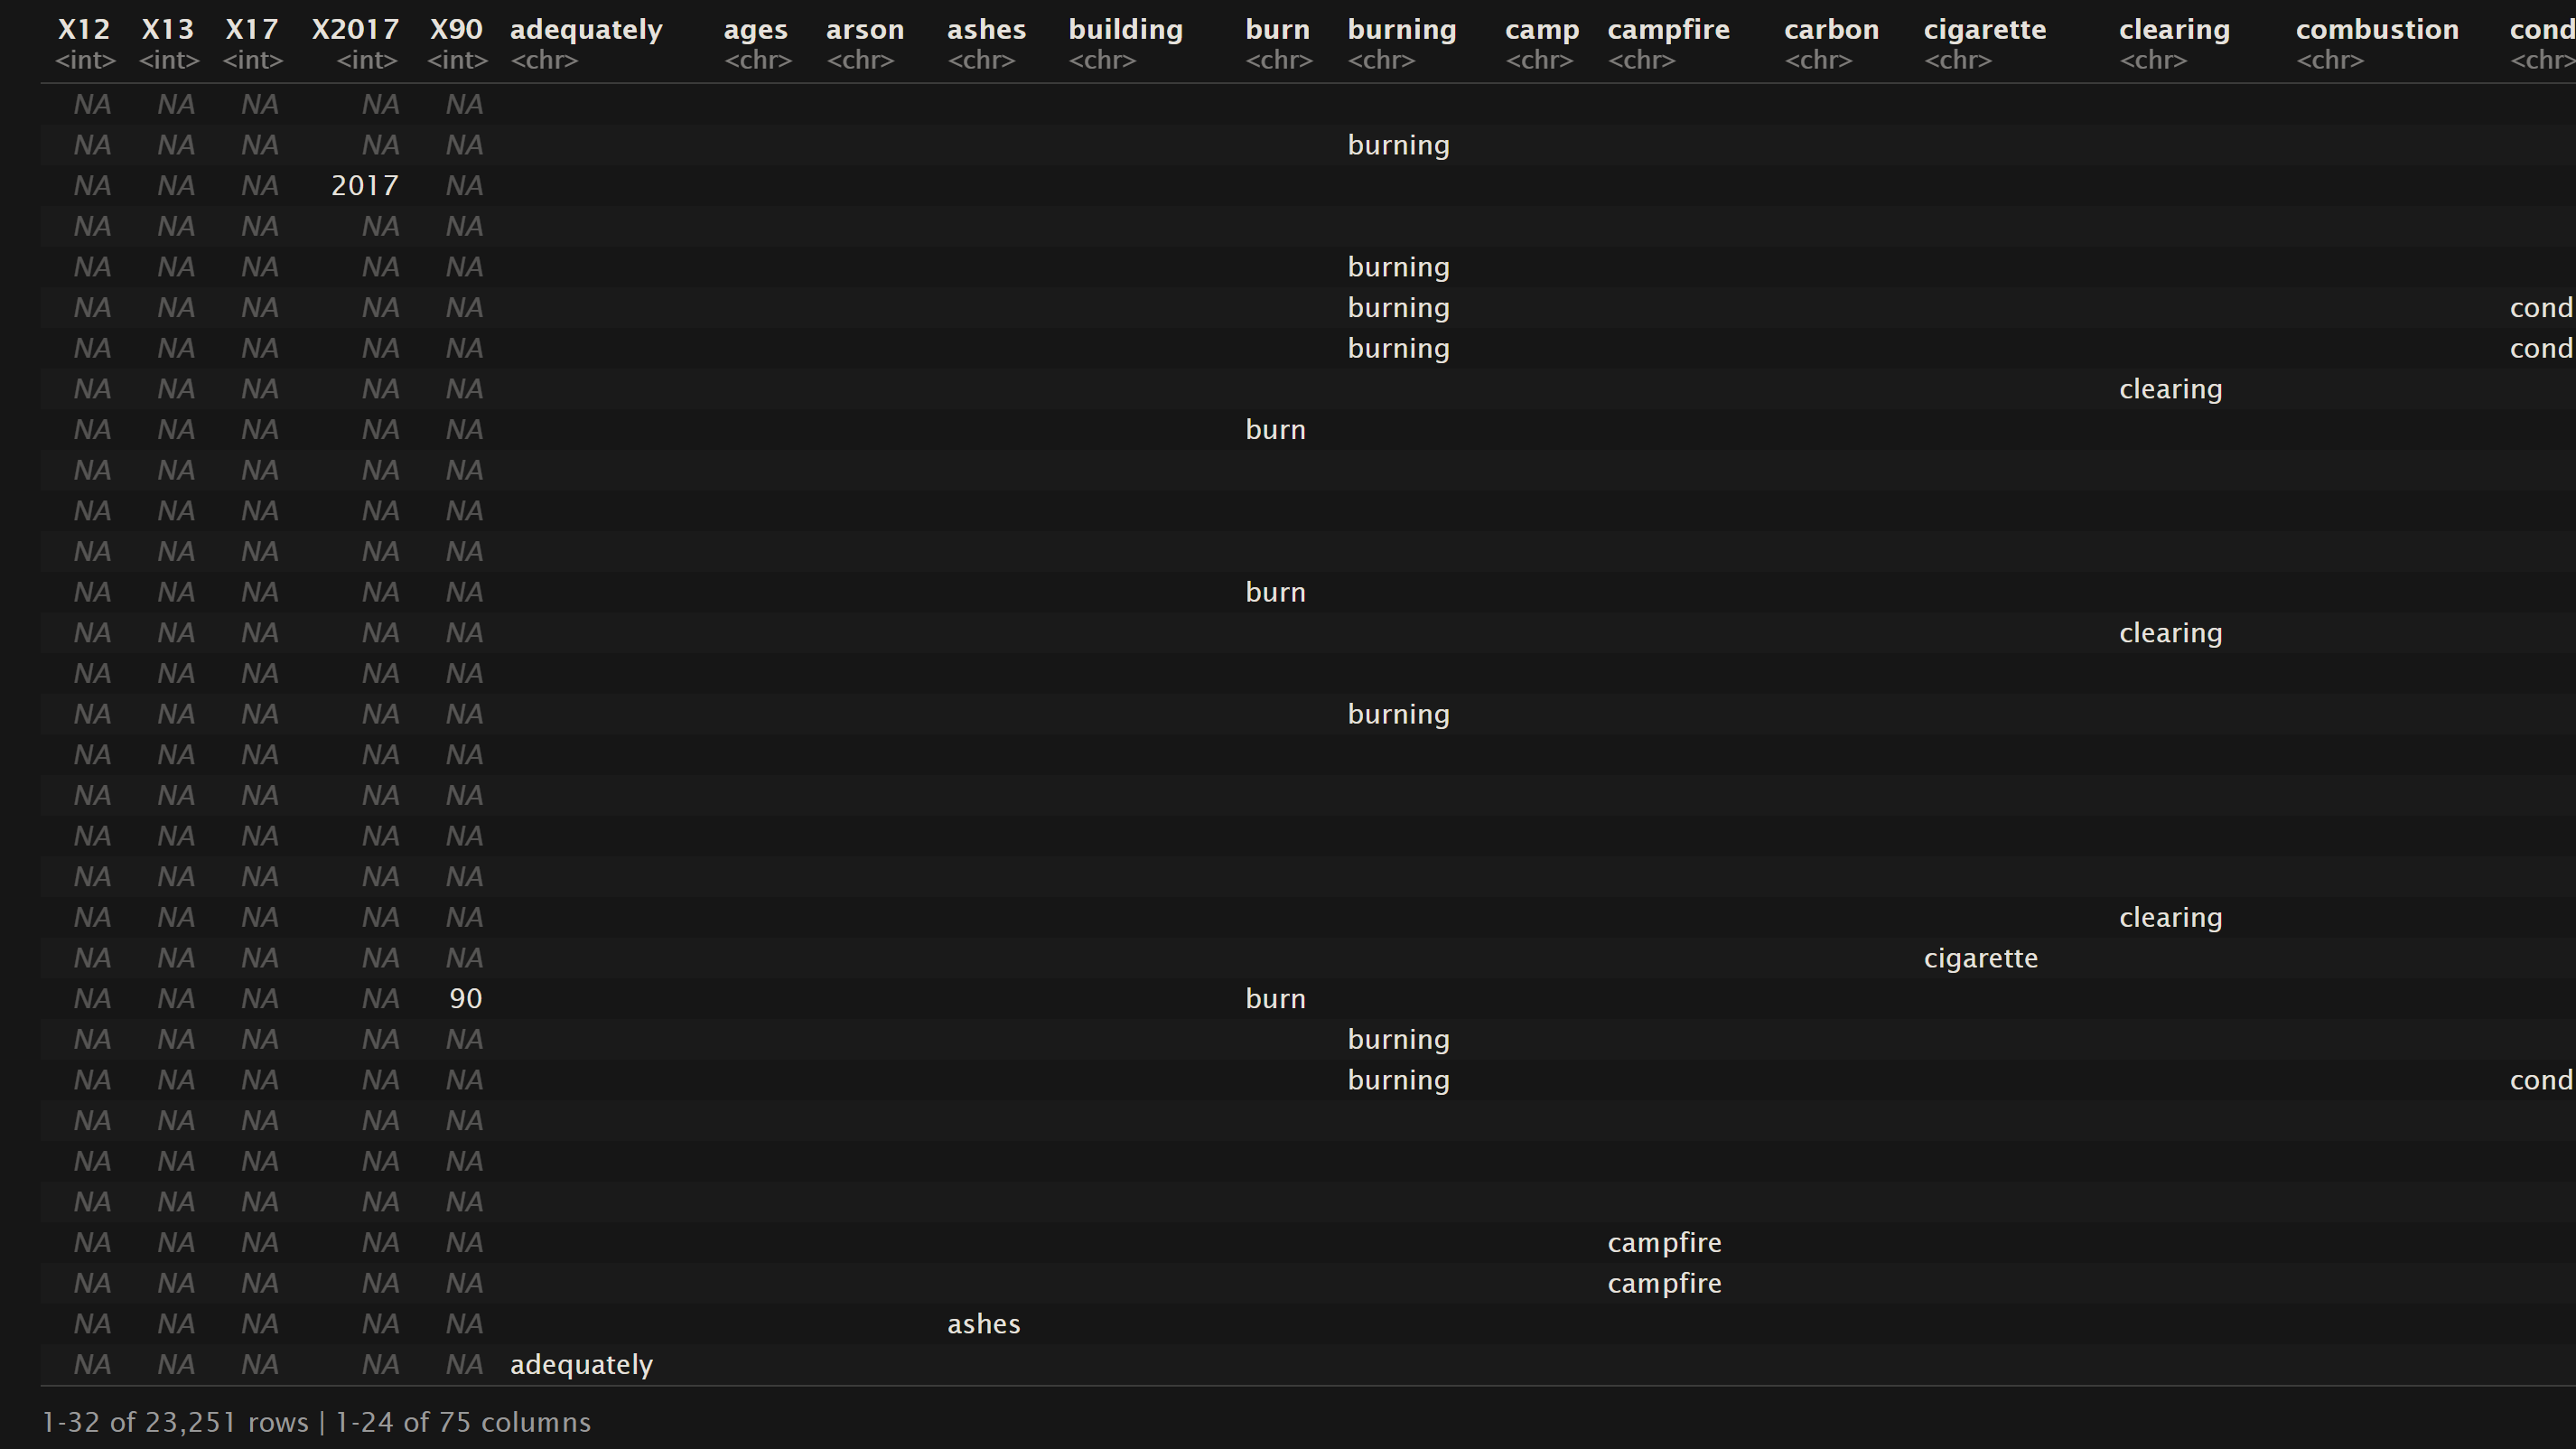
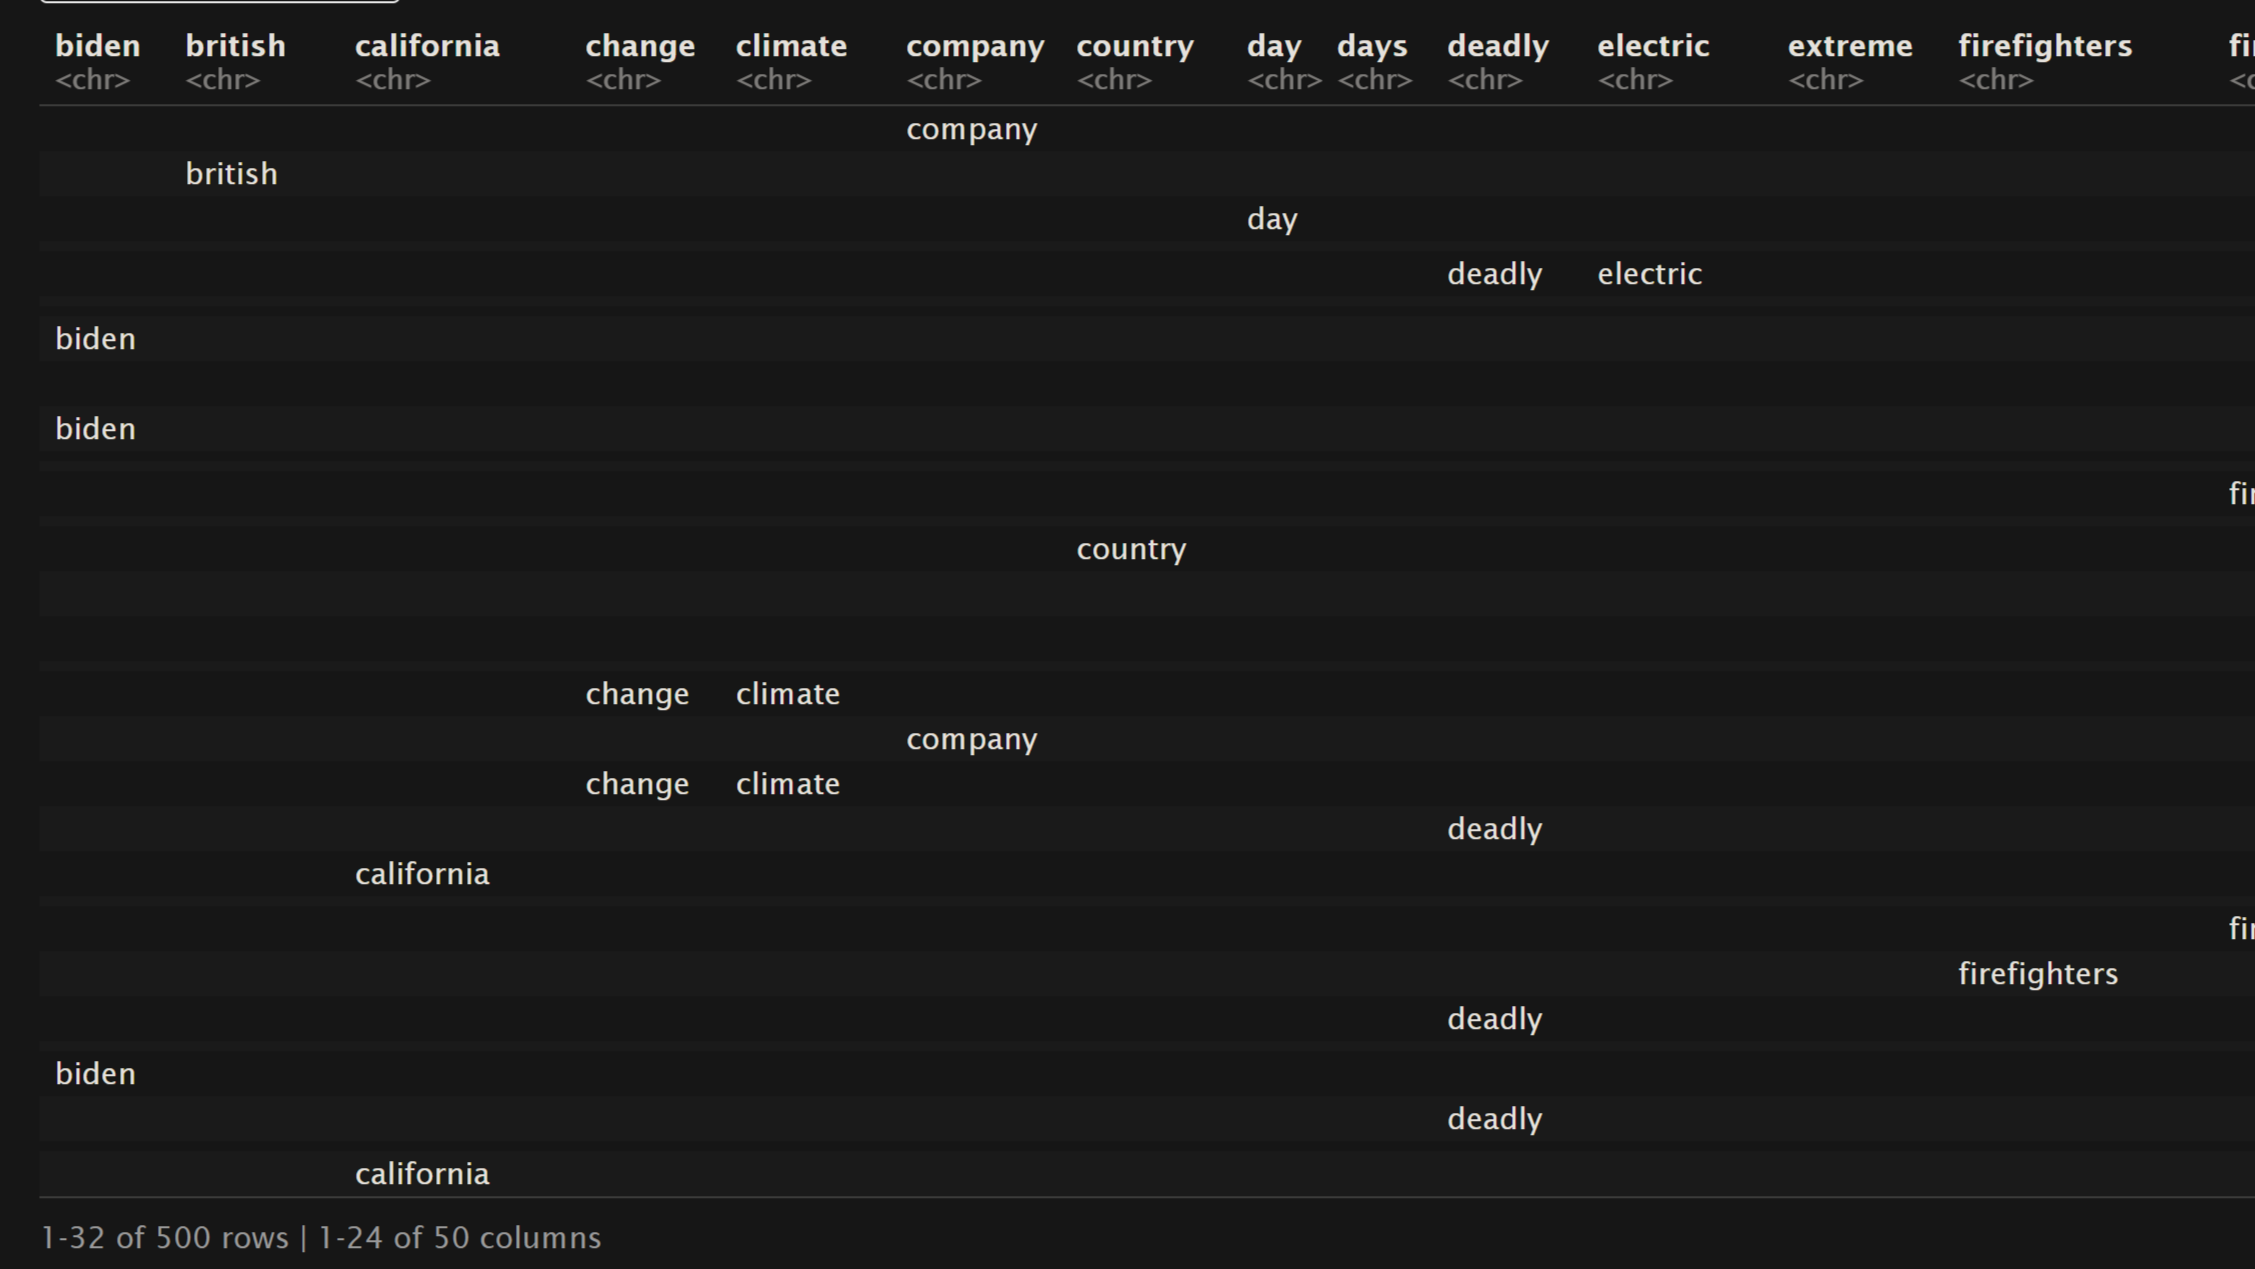
The provided snapshots of the dataframes (representing a subset of the complete dataset) offer an insight into the structure of basket data. In this context, each row represents a distinct transaction, containing the words associated with the corresponding label. It’s worth highlighting that the frequency of a term within a single transaction is not documented; instead, the focus is on whether a term is present or absent within a given transaction.
The preference for transactional data in association rule mining is rooted in its suitability for capturing binary relationships. In essence, this binary representation signifies whether an item (or word) is part of a transaction or not. This binary nature simplifies the association rule mining process, making it easier to identify meaningful patterns and relationships between items. This approach is particularly useful in scenarios where the emphasis is on understanding the co-occurrence or association of items within transactions rather than their quantitative frequency. By using transactional data, we can effectively uncover valuable insights about item associations and their implications, which might be less evident when dealing with frequency-based data.
For this section, a deliberate choice has been made to remove label columns. This decision is driven by the desire to explore the relationship between the words themselves, and not have the data be biased to the abundance of the labels in the dataset. This approach could shed light on the types of words commonly linked to news stories about fires and the vocabulary used to describe the various causes of these fires.
Code
The association rule mining and all other code within this project can be found in the GitHub repository here. Specifically ARM is performed in the file: arm.Rmd. The inspiration for the code is from Dr. Ami Gates ARM in R4.
Results
In this section, we’ll share the results of our association rule mining analysis, providing valuable insights into the connections between words concerning drought, fire, and the factors contributing to these fires. For our analysis, we’ll employ the Apriori algorithm, rooted in deductive reasoning from general principles to expected outcomes. The goal is to offer a comprehensive grasp of the rules and their quantitative values (support, confidence, and lift) as well as informative visuals in the form of network diagrams and frequency graphs, enriching one’s understanding of the discovered patterns. For the Apriori algorithm there are some minimum requirements around the support, confidence, and number of terms in the rule that are used to for this deductive logic. For the three datasets used different minimums were set so that the resulting number of rules landed between 30 and 70. The idea was to create a useable amount of rules would be sufficient for analysis. Keep in mind that the datasets being used are very large and have lots of words, so low values of support are more caused by each word itself being infrequent and not about if those words are infrequent together.
Thresholds
Oregon Wildfires and Weather Cause Comments:
- minimum support = 0.02
- minimum confidence = 0.05
- minimum number of terms in rule = 2
Oregon Wildfires and Weather Specific Comments:
- minimum support = 0.03
- minimum confidence = 0.05
- minimum number of terms in rule = 2
News Headlines:
- minimum support = 0.025
- minimum confidence = 0.05
- minimum number of terms in rule = 2
Top 15 rules for Support
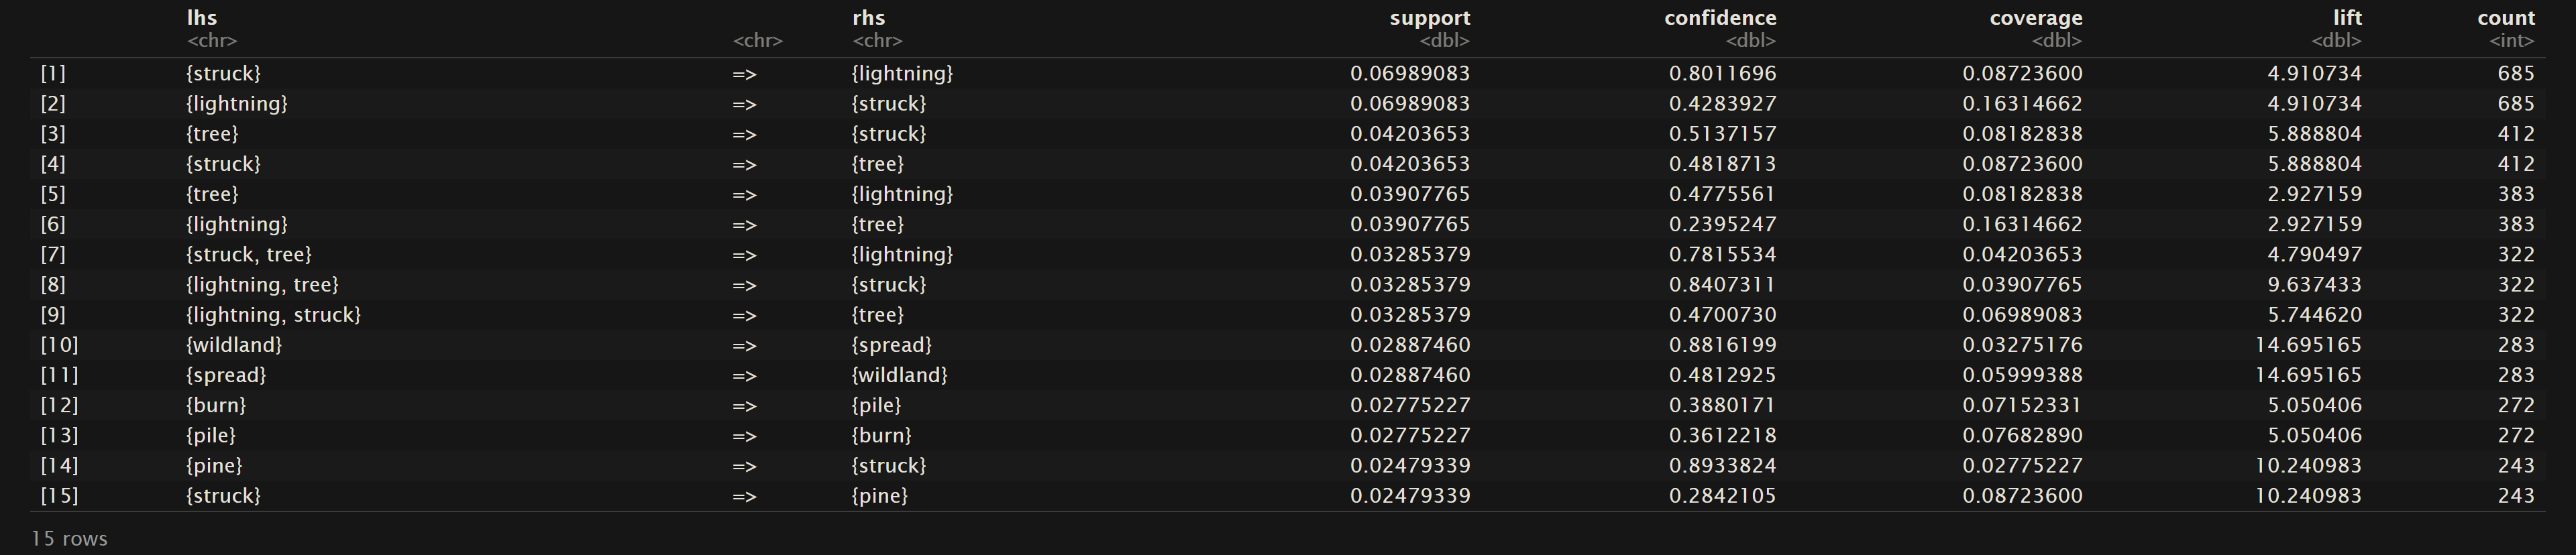
As mentioned above in the general overview of ARM support is defined as the probability of that event A occurring. Below are the sorted top 15 rules for the three datasets (Oregon Wildfires and Weather Cause Comments, Oregon Wildfires and Weather Specific Comments, and News Headlines; respectively) for their value of support.
Oregon Wildfires and Weather Cause Comments
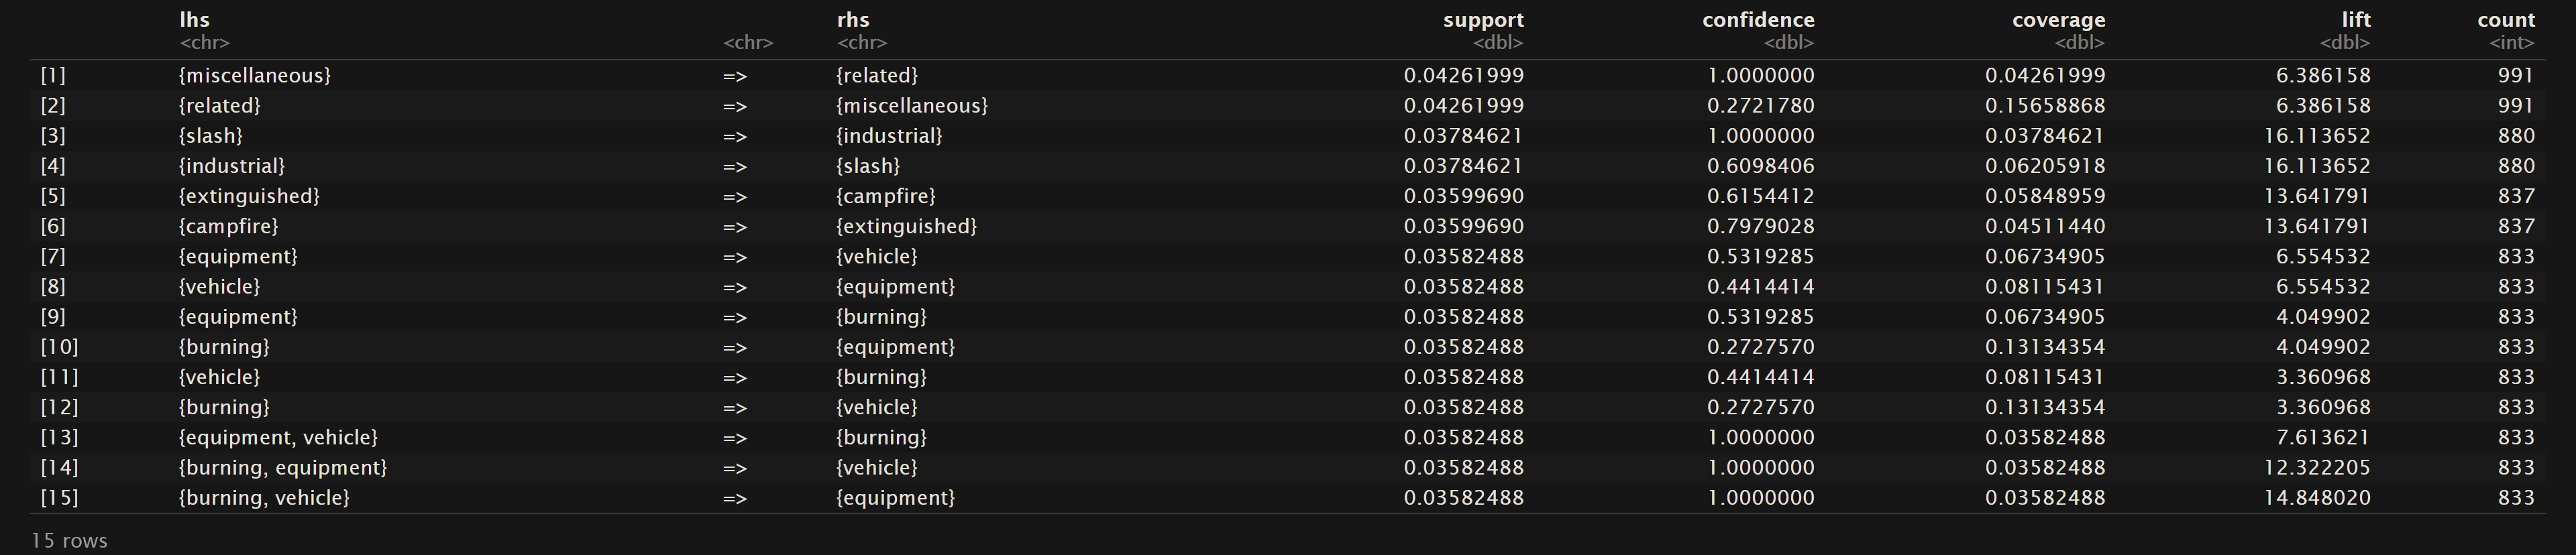
Oregon Wildfires and Weather Specific Causes
News Headlines
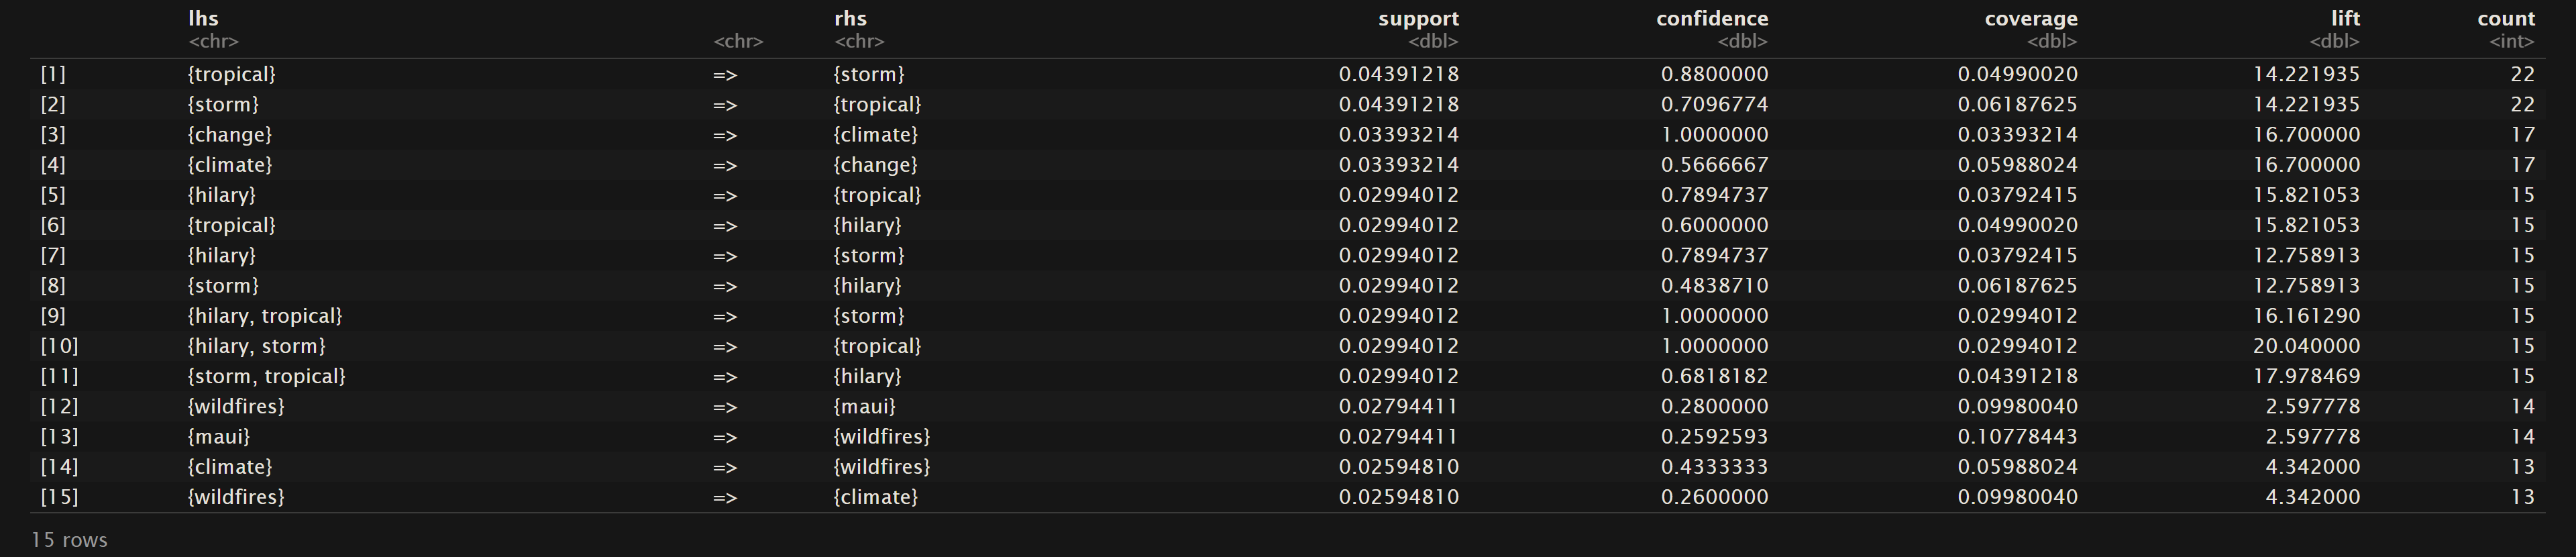
As mentioned in the Overview, support is referring to the frequency that the values on the left hand side and right hand side are seen together. In statistical terms it the probability that these terms are in the same transaction or row of the dataset. For the Oregon Wildfires and Weather Cause Comments dataset we can see that “lightning” and “struck” are found together in the dataset about 7% of the time. The top 15 terms for support are mainly centered around “lightning”, “tree”, “struck”, and “spread”. In the Oregon Wildfires and Weather Specific Cause dataset the terms “miscellaneous” and “related” are found together about 4% of the time. The main terms in the top 15 rules sorted by support contain words like “miscellaneous”, “related”, “equipment”, “industrial”, “vehicle”, and “burning”. Lastly in the NewsAPI Headlines dataset the top support terms were “tropical” and “storm” where they were found together about 4% of the time. Other frequent terms include “storm”, “hilary”, wildfires”, and “maui”.
Top 15 rules for Confidence
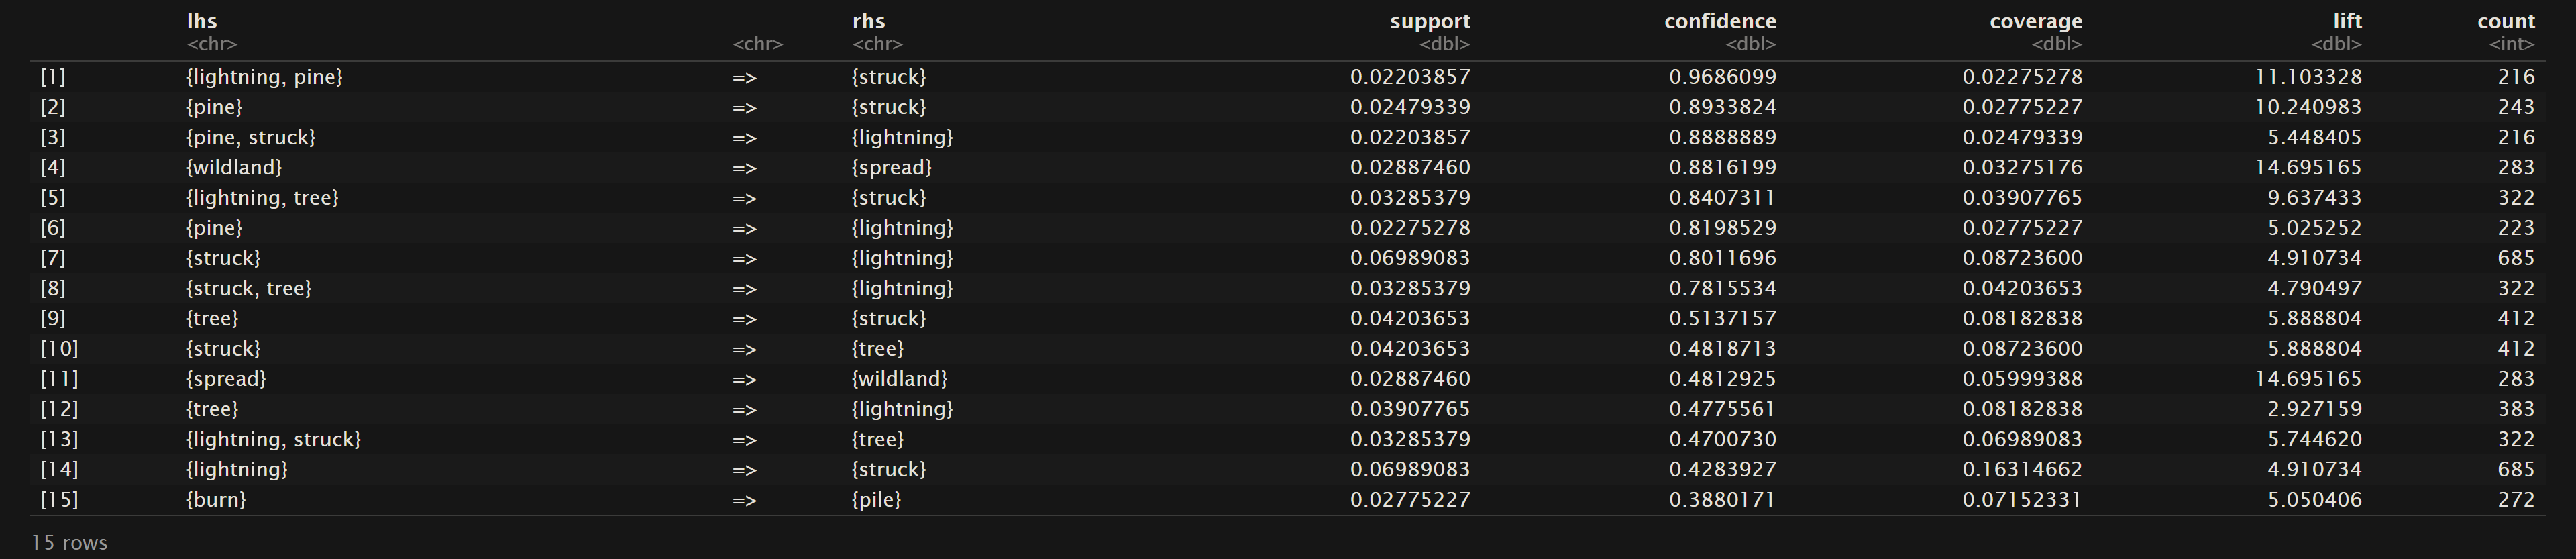
Oregon Wildfires and Weather Cause Comments
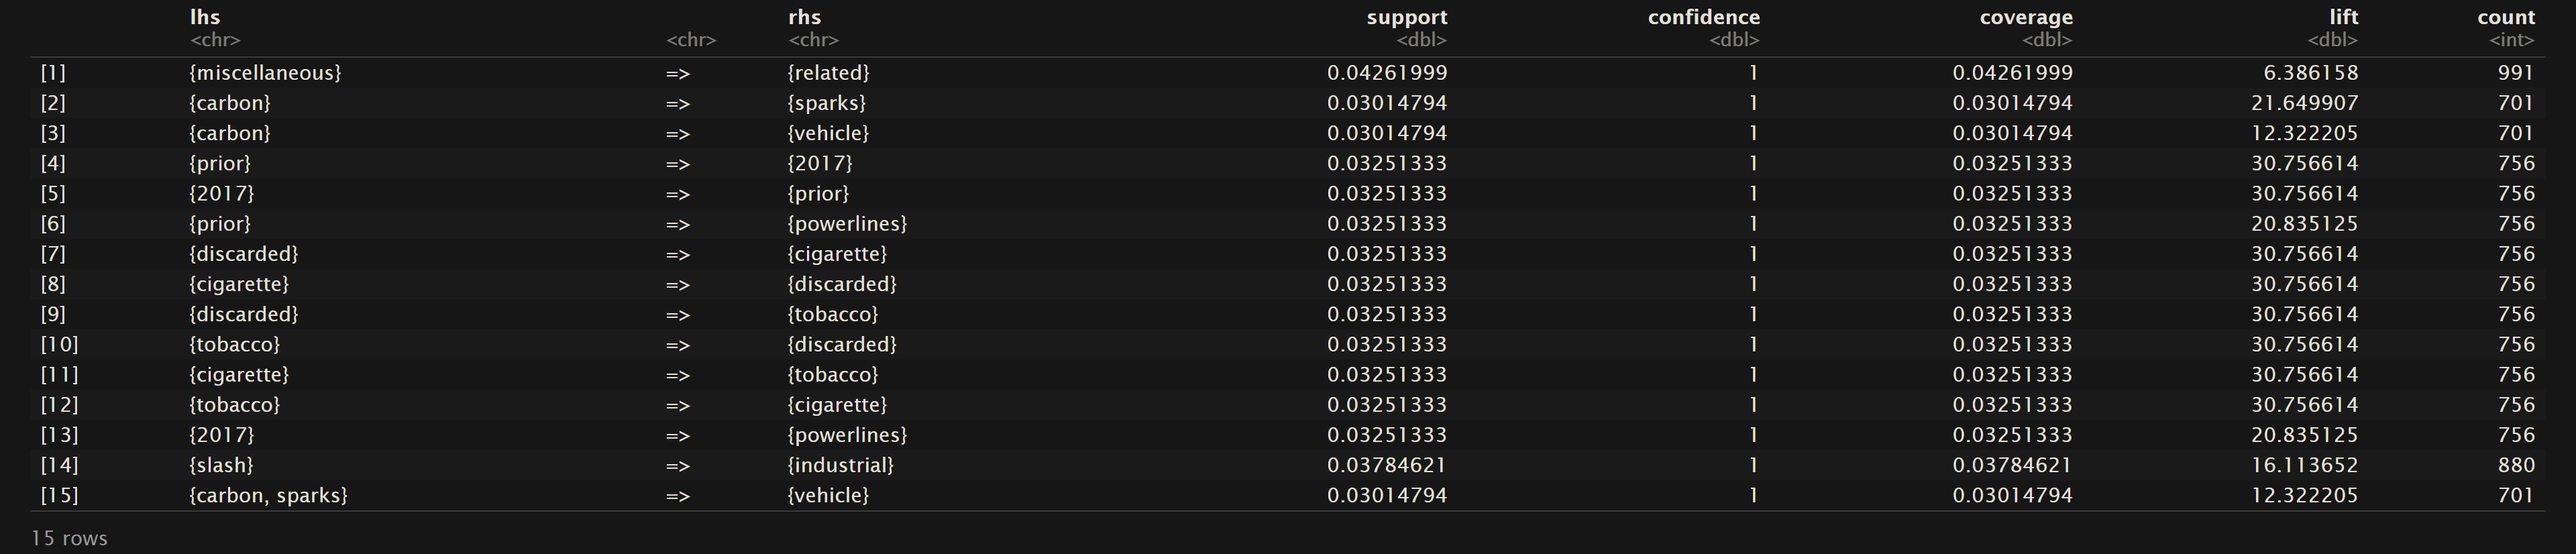
Oregon Wildfires and Weather Specific Causes
News Headlines
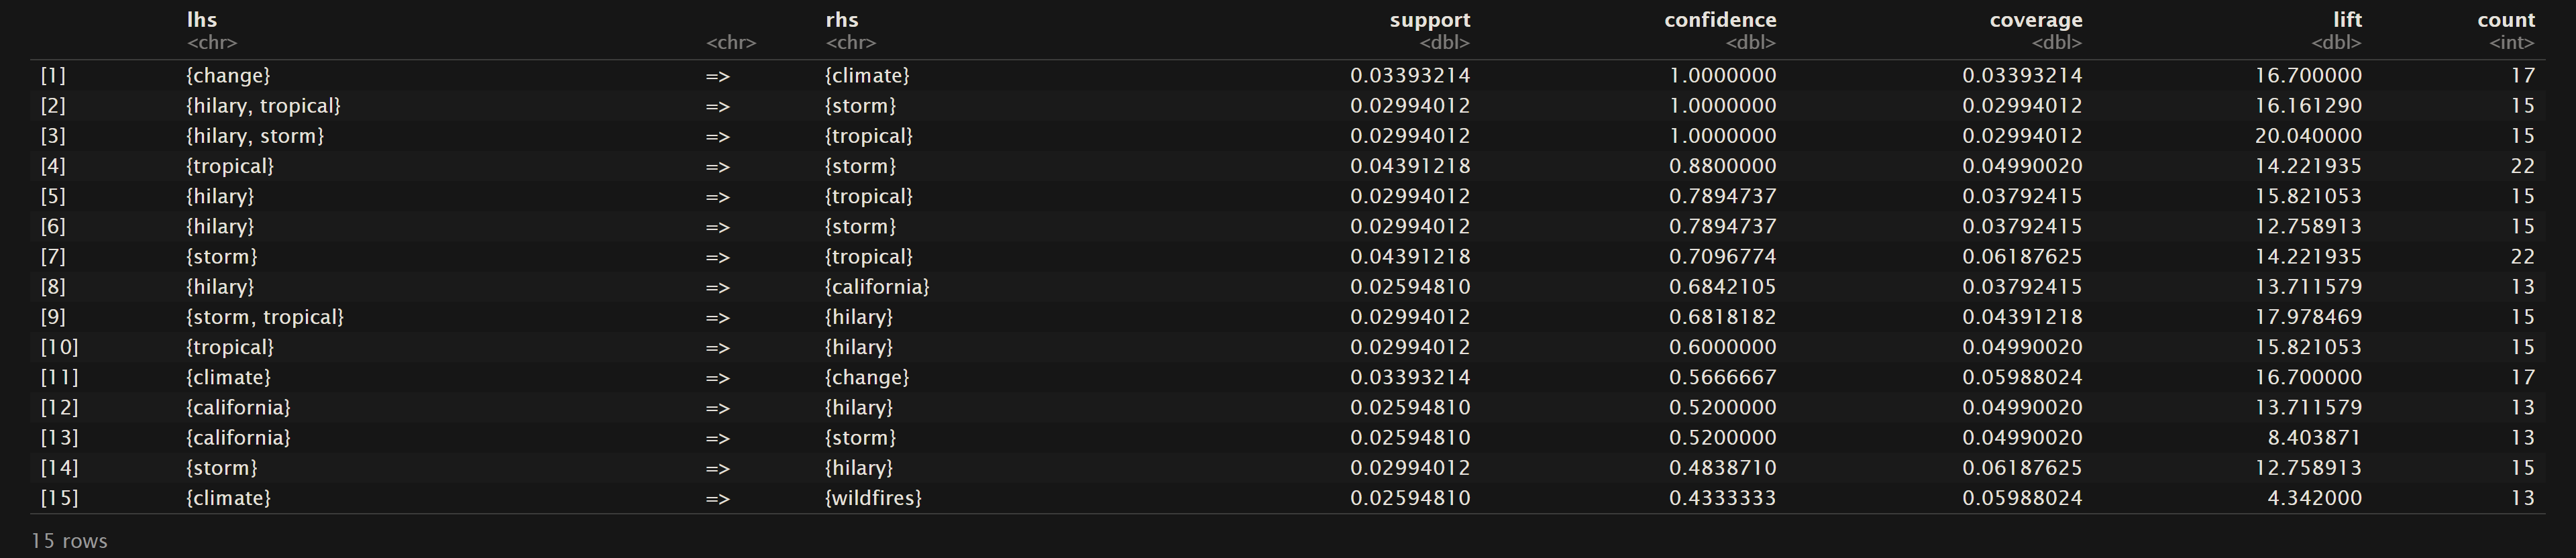
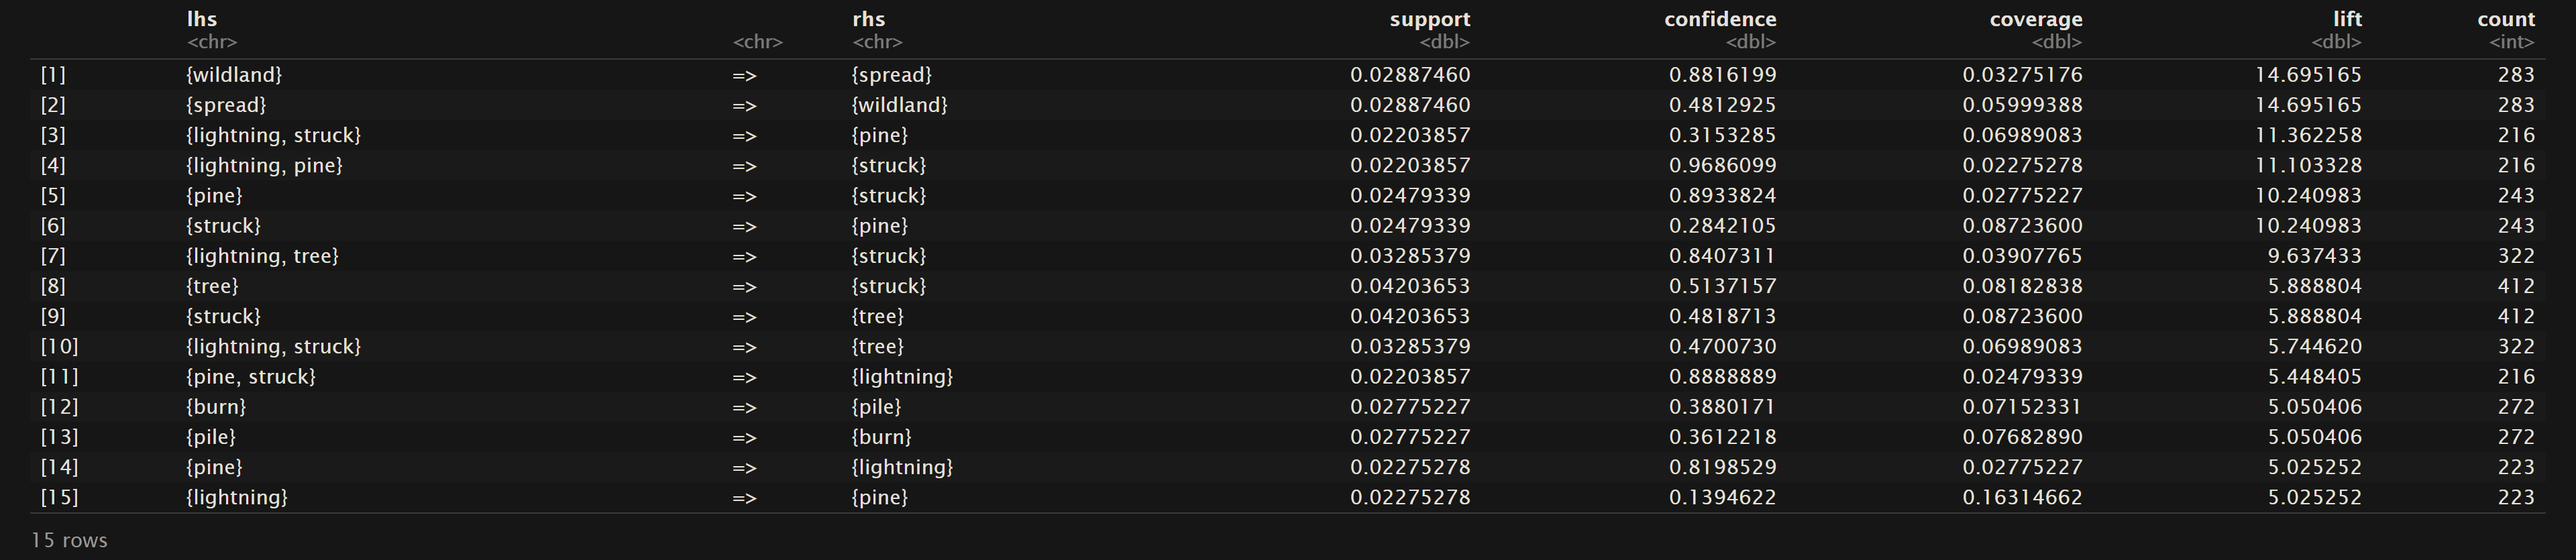
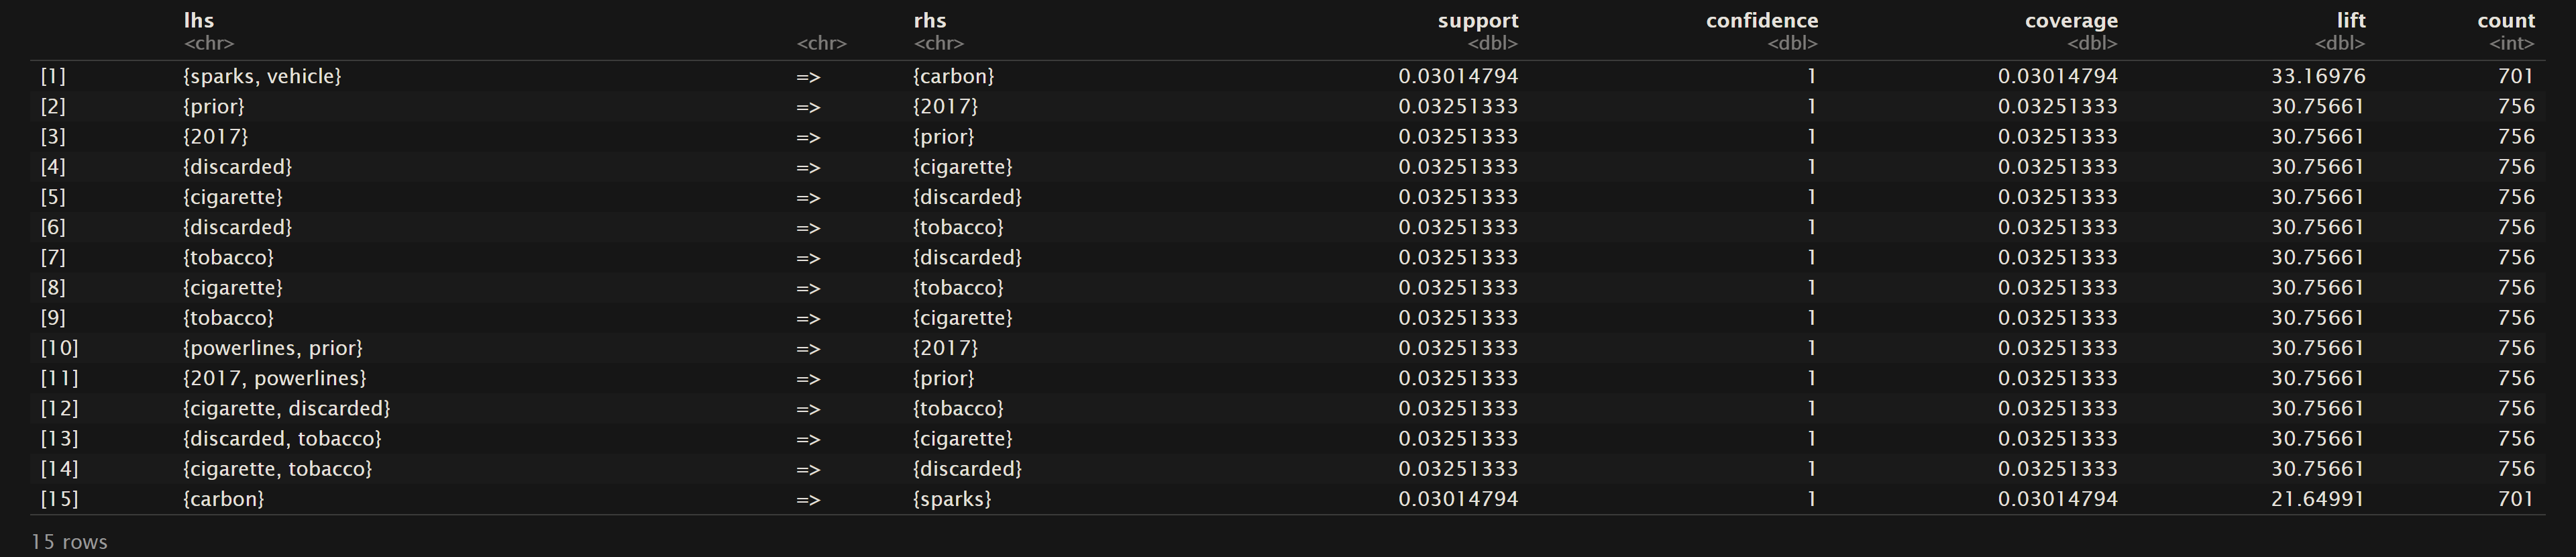
Confidence (as mentioned in the overview) pertains to the conditional probability. Therefore as we can see for the sorted rules based on confidence that in the dataset Oregon Wildfires and Weather Cause Comments that given the terms “lightning” and “pine” then “struck” had about a 97% likelihood of also being mentioned. In the NewsAPI Headlines dataset one can see that there is a 100% likeihood that “change” will be also seen with “climate”, but the other way around only has a confidence of 0.5667. This shows that all of the headlines using “change” they were also discussing “climate”, but about half of the headlines discussing “climate” did not mention “change”. Lastly, one should note that all of the top 15 confidence levels for the Oregon Wildfires and Weather Specific Comments are 1. This points to a trend of phrases that commonly pair certain words together when describing a specific cause of a fire in the Oregon fires from 2000 to 2022.
Top 15 rules for Lift
Oregon Wildfires and Weather Cause Comments
Oregon Wildfires and Weather Specific Causes
News Headlines
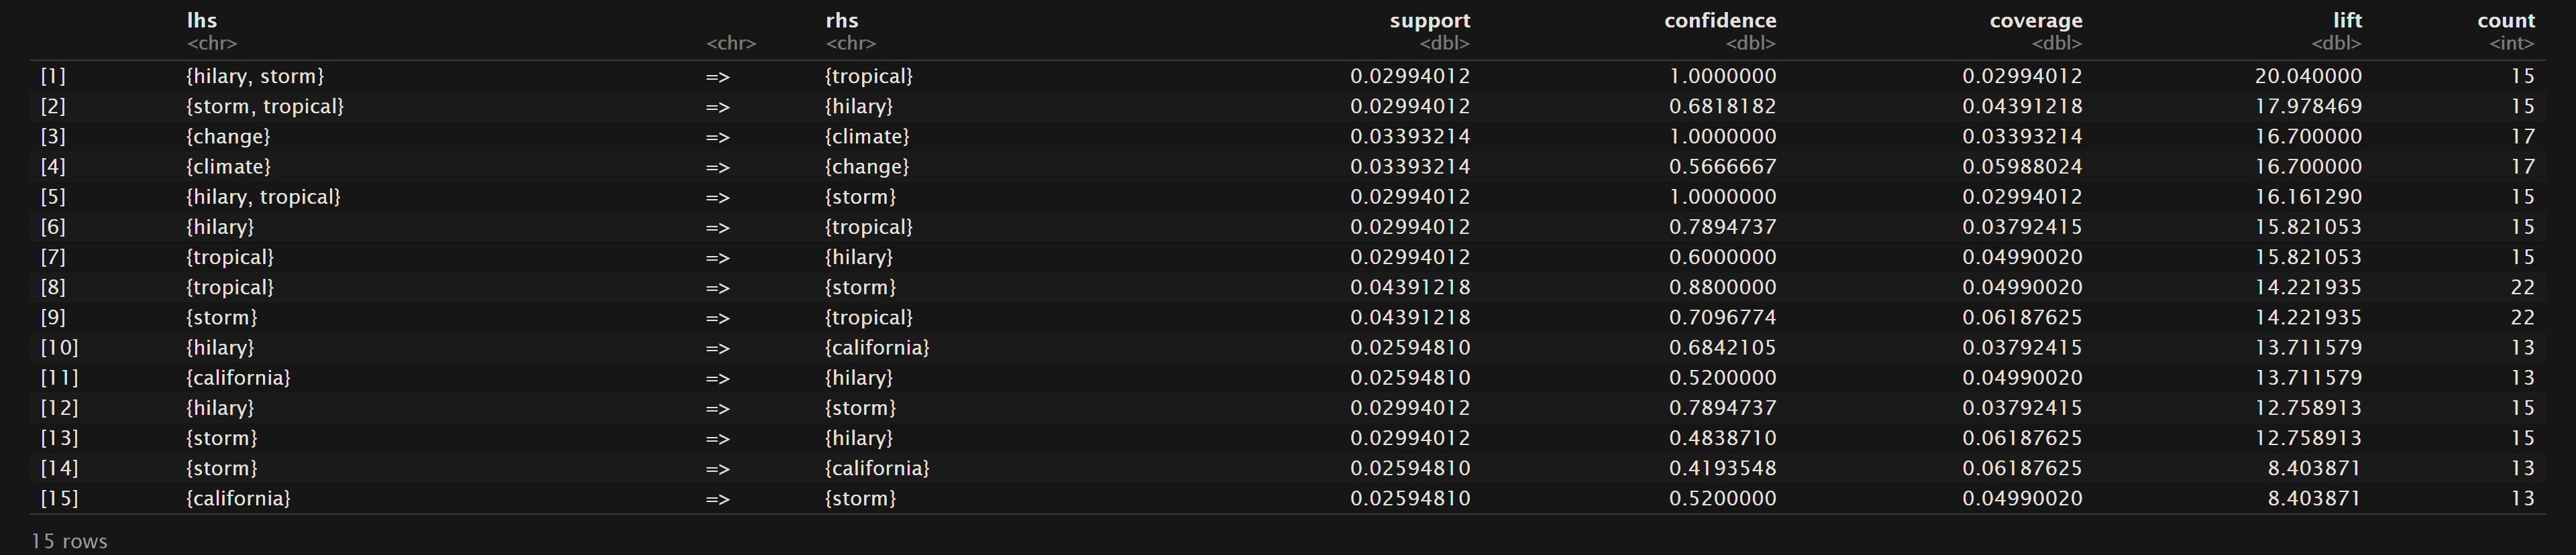
As mentioned above in the Overview of Measures in Association Rule Mining, lift measures the strength of the relationship. “A lift value greater than 1 indicates that the rule body and the rule head appear more often together than expected, this means that the occurrence of the rule body has a positive effect on the occurrence of the rule head.”5 As one can see for the top 15 sorted rules based on lift, all of these rules have a lift greater than 1. Therefore in general all of the rules in this section have a positive association. Thus for {A} => {B} means that {A} has a positive effect on the presence of {B}. For example in the Oregon Wildfires and Weather Cause Comments dataset {wildland} => {spread} with a lift of about 14.7 tells us that if the comment uses the word “wildland”, then we could confidently assume that “spread” will also be used.
Visualization
Now that we have thoroughly examined the results of the support, confidence, and lift metrics in our association rule mining analysis, it’s time to shift our focus to the visual representations that will provide a more intuitive understanding of the patterns and relationships uncovered in our data. All visuals in this section can be found in the ARM folder within CreatedVisuals in the GitHub repository here.
To guide our exploration further, our next step is to delve into the top 20 terms within each of the datasets. This analysis will offer valuable insights by shedding light on the most frequently used words when discussing the causes of fires and those prevalent in media discussions related to similar topics. This preliminary examination aims to establish a foundational understanding of the key terminology in both contexts.
In the above graphs we get a glimpse into the most frequently used words for our topics. For the datasets relating to the Oregon Wildfires and Weather from 2000 to 2022 we see that both for the cause comments and for the specific comments “lightning” is the number one cause for fires (by a significant margin). This discovery underscores the formidable role that natural elements play in fire incidents, and it raises questions about our preparedness to mitigate the impact of such natural events. Understanding this crucial factor not only helps us grasp the core reasons behind fire occurrences but also highlights the importance of proactive measures to manage and prevent wildfires, particularly in areas prone to lightning strikes. This revelation serves as a crucial starting point for devising strategies to safeguard communities and ecosystems from the devastating consequences of wildfires ignited by lightning.
Furthermore, it’s essential to highlight another significant discovery within our analysis – the prominent occurrence of terms such as “vehicle,” “equipment,” and “industrial” in relation to fire causes. This observation suggests a substantial proportion of fire incidents are attributed to factors associated with vehicles, equipment malfunctions, and industrial activities. This finding underscores the multifaceted nature of fire causality, with human-made factors and machinery failures playing a substantial role alongside natural causes like lightning. It underscores the necessity for a comprehensive approach to fire prevention and safety that addresses both the natural and human-related aspects, emphasizing the importance of stringent safety protocols, maintenance, and vigilance in these areas.
In the NewsAPI Headlines dataset, our analysis of the headlines from September 16th, 2023, revealed that the most commonly used words were “maui,” “people,” and “wildfires.” Notably, the Maui fire, which occurred on August 8th, 2023, had a profound and lasting impact on numerous lives and the community. Given the magnitude of this devastating event, it is entirely reasonable that media discussions were still centered around it, making it one of the dominant topics in wildfire-related news. This demonstrates significance of events like the Maui fire and their far-reaching consequences, which continue to capture public attention and demand ongoing coverage and attention.
Another visual tool that was created for the Association Rule Mining analysis was rule networks. These help with giving a conceptual network of how the terms associated with one another. Below are the three network created for the Oregon Wildfires and Weather Cause Comments, News Headlines, and Oregon Wildfires and Weather Specific Comments; respectively.
The three graphs above depict graphical networks illustrating the associations among various words. These networks group words together with connections between them. In the network representing Oregon Wildfires and Weather Cause Comments, the words “lightning,” “tree,” “pine,” and “struck” form a distinct subset, indicating an association among them. Notably, the network shows significant support for both {lightning} => {struck} and {struck} => {lightning}, along with substantial support for {lightning, struck} => {tree}. Previous knowledge from Hierarchical Clustering revealed the presence of pine, ponderosa, and juniper trees in the dataset. However, only pine exhibited associated rules with support greater than our minimum threshold of 0.02. Further investigation into the density of pine trees in Oregon could elucidate whether this association is due to their abundance or other factors leading to more lightning strikes on pine trees.
Another network graph pertains to Specific Causes within the Oregon Wildfires and Weather dataset. This graph reveals multiple subnetworks, with one focused on “vehicle,” “equipment,” “burning,” “carbon,” and “sparks,” and another centered around “cigarette,” “tobacco,” and “discarded.” Each of these subnetworks represents distinct scenarios for fire causes. Similar to how “lightning” and “struck” represent natural fire initiators, these networks showcase human-related factors contributing to fire outbreaks.
Lastly, the network derived from NewsAPI Headlines exhibits two prominent clusters. One cluster includes “maui,” “wildfires,” “climate,” and “change,” while the other comprises “storm,” “California,” “Hilary,” and “tropical.” The latter cluster is easily explained by the significant impact of the Hilary storm on California on August 20th, 2023, resulting in extensive damage. The former cluster is intriguing as it reflects the discourse surrounding climate change in relation to wildfires. Given the prevalence of the phrase “climate change,” the high association between these words is expected. What stands out is the connection between “climate” and “wildfires,” warranting further exploration.
Conclusions
In conclusion, our Association Rule Mining analysis of wildfire data has provided valuable insights into the primary causes and factors contributing to wildfire incidents, as well as the ongoing media discourse surrounding these events.
The analysis of the Oregon Wildfires and Weather datasets from 2000 to 2022 has emphasized the significant role of natural elements, particularly “lightning,” in igniting wildfires. This revelation highlights the need for proactive measures and preparedness to mitigate the impact of such natural events, especially in areas prone to lightning strikes. Understanding the core reasons behind fire occurrences is essential for devising strategies to safeguard communities and ecosystems from the devastating consequences of lightning-induced wildfires. Moreover, the ARM analysis has shed light on the significant occurrence of terms like “vehicle,” “equipment,” and “industrial” in relation to fire causes. This highlights the multifaceted nature of fire causality, with human-made factors and machinery failures playing a substantial role alongside natural causes. It shows the importance of a comprehensive approach to fire prevention and safety that addresses both natural and human-related aspects, emphasizing stringent safety protocols, maintenance, and vigilance.
The examination of NewsAPI Headlines data from September 16th, 2023, revealed that the Maui fire, which occurred on August 8th, 2023, had a profound and lasting impact, dominating media discussions. This reveals the significance of major wildfire events and their far-reaching consequences, demanding ongoing coverage and attention. It is also worth noting the media association of the words “wildfires” and “climate”. As looking into the impacts of climate change on the increase of severity of fires may lead to saving lives in the future.
Additionally, our analysis utilized rule networks to provide a conceptual understanding of the associations between terms. These networks highlighted distinct subsets of associations, such as the connection between “lightning,” “struck,” and “tree” in Oregon Wildfires and Weather Cause Comments. These associations offer further insights into the interplay of factors contributing to wildfires.
In summary, this Association Rule Mining analysis has deepened our understanding of wildfire causality and the ongoing discourse surrounding these events. It provides a foundation for informed decision-making, proactive wildfire management strategies, and continued awareness of the dynamic factors at play in wildfire incidents.
- “The Data School – Understanding Support, Confidence, Lift for Market Basket (Affinity) Analysis.” The Data School RSS, www.thedataschool.co.uk/liu-zhang/understanding-lift-for-market-basket-analysis/. Accessed 1 Oct. 2023.
↩︎ - “Apriori Algorithm.” GeeksforGeeks, GeeksforGeeks, 13 Jan. 2022, www.geeksforgeeks.org/apriori-algorithm/.
↩︎ - “Apriori Algorithm.” GeeksforGeeks, GeeksforGeeks, 13 Jan. 2022, www.geeksforgeeks.org/apriori-algorithm/.
↩︎ - Gates, Ami. “ARM in R.” Gates Bolton Analytics, University of Colorado – Boulder, gatesboltonanalytics.com/?page_id=268. Accessed 1 Oct. 2023. ↩︎
- “Lift in an Association Rule.” IBM Documentation, IBM, 1 Mar. 2021, www.ibm.com/docs/en/db2/10.5?topic=SSEPGG_10.5.0%2Fcom.ibm.im.model.doc%2Fc_lift_in_an_association_rule.htm.
↩︎
